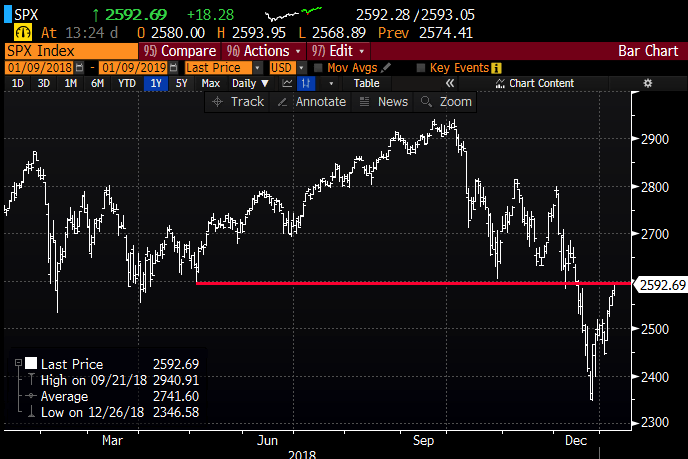
Last week on CNBC’s Fast Money, a frequent guest, and all around good guy Tony Dwyer showed some pretty interesting data regarding the last three times (in 1987, 1998, 2011) that the S&P 500 (SPX) had a 20% peak to trough decline in less than 4 months, like the one we just had, which he categorizes as a ‘market crash’. The most important takeaway for me was that in the three instances he highlights, Tony notes that soon after the crash, the SPX in all three instances saw what he calls a reflex rally that averaged about 13%. Tony goes on to note that following the reflex, the market went back and re-tested the prior low. Tony makes the case in the video below, that before we can make new highs in 2019, something the SPX did in these three instances, which he suggested were in “non-recessionary environments” we are very likely to re-test last month’s low in the SPX near 2350, watch here:
That was last week, today the SPX is up about 10% from its lows made late last month, and now approaching what some might view as near-term technical resistance. If the bounce post-crash is commensurate with the average of the last three 20% peak to trough declines in less than four months, then maybe its has another 50 or so S&P points before the re-test.
Tony also highlighted a key feature for the re-test after the reflex bounce… a collapse in volatility. Short-dated options prices in the SPX, while down considerably from the recent highs, with 30-day at the money implied volatility (blue line below, the price of options) down from 30% to 17% in just two weeks, while realized volatility (white line below, how much the SPX is actually moving) has remained bid.
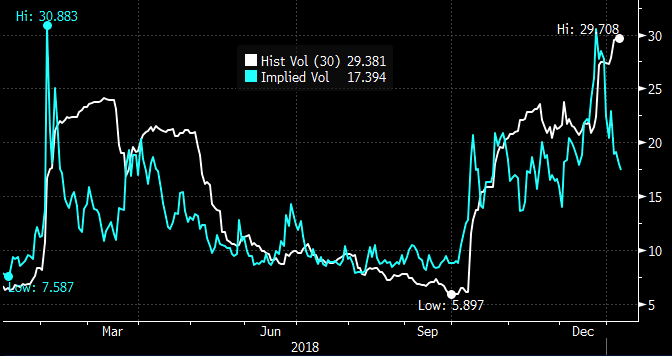
If we continue to get these intra-day swings, gap openings, and/ or late day dumps that have been emblematic of our stock market since early October, then I suspect options prices in the SPX, while still well off of their 52-week lows in the high single digits, will prove to be too low.
Just prior to the late December implosion I detailed a bearish hedge in the SPY the etf that tracks the SPX, from December 14th, I SPY A Wild Ride, suggesting:
If you were of the mindset that trump’s presidency is in an increasingly compromised position which could cause him to become increasingly erratic on issues such as the budget/government shutdown, trade, Fed policy, foreign policy and the general rule of law, then it might make sense to seek some near-term protection in the SPY.
Here was the trade idea:
HEDGE IDEA: SPY ($261.25) BUY FEB 260 / 220 PUT SPREAD FOR $7
-Buy to open 1 Feb 260 put for $8
-Sell to open 1 Feb 220 put at $1
Well, all of the negative catalysts seemed to collide and the SPY went from ~$261 to a low of ~$234 on December 24th, and the $40 wide put spread that cost $7 when the SPY was $261 on Dec 14th was worth $22 less than two weeks late, we detailed how one might roll the position to lock in some of the gains (read here).
So what now? If I were inclined to play for Tony’s re-test, after the reflex, and that it makes sense to take a slightly more cautious view as we head into Q4 earnings season next week, then I might consider the following trade idea:
SPY ($258.70) Buy Feb 255 / 240 put spread for $3
-Buy to open 1 Feb 255 put for 4.60
-Sell to open 1 Feb 240 put spread at 1.60
Break-even on Feb expiration:
Profits of up to 12 between 252 and 240 with max gain of 12 at 240 or lower.
Losses of up to 3 between 252 and 255 with a max loss of 3 at 255 or higher.
Rationale: This trade idea risks a little more than 1% of the etf price for a little more than a month, offering a potential 4 to 1 payout with break-even in less 3%.