I am not a formally trained market technician, but sometimes I play one on TV. As regular readers know I use charts as one input to whatever thesis I might be developing on a stock or an ETF, which usually starts with some sort of catalyst. Technical levels often give me a sense for where support and resistance lie while attempting to set targets for options trade ideas, assisting in the choice of strikes, for vertical spreads, calendars, or collars.
When I was starting out in the business in the late 1990s at a hedge fund, the firm brought in an instructor from the New York Institute of Finance to teach two their young bucks courses on financial charting. I remember at the time how unique an experience it was to be learning something in an academic setting that I could immediately apply to my profession, especially one that I knew so little about what it would take to be successful.
The portfolio manager that I worked for was a self-taught momentum trader (by many accounts one of the best of that period) who relied a great deal on technicals to reveal reversal patterns after sharp drops, breakout patterns after long consolidations, or exhaustion patterns where it appeared a move would come to an end an offer an attractive short entry. He gave me a Gateway computer loaded with a charting package that each night I had to go home, plug into my AOL dial-up account, download the day’s data, and search 1000+ charts hoping to identify a handful of these sorts of patterns and pitch to him the next day. Once he felt I had a handle on the charts, unlike most classicly trained market technicians he would demand that I have a sense for what was going on with the underlying company, upcoming catalysts which might include; earnings, analyst meetings, product news (there own or competitors), analysts sentiment (potential for earnings revisions and/or upgrades), insider buying/selling etc etc etc. The list went on and on, so it was the marriage of technicals and what most chartists call “funny-mentals”, but make no mistake the whole strategy was based on buying stocks whose momentum would be increasing and selling those where it would be decreasing.
22 years later I find it interesting that while I still spend most of the day between 8am and 4pm staring at a Bloomberg screen, I now spend the majority of my time reading news stories, blog posts and research reports, while charts are always the last thing I look at. Back then, new stories were WSJ, NYT Business and Investors Business Daily, with Barron’s on the weekends. CNBC & Bloomberg broke stories real time and the next day it would be in the paper for the non-professionals to read. Equity research reports from brokerages houses had a much greater influence on stock prices, and this was before Reg FD so lots of hedge funds usually knew what analysts were going to do based on the news coming out of companies before the analysts did, or least that was the goal, and thus the implementation of Reg-FD in late 2000.
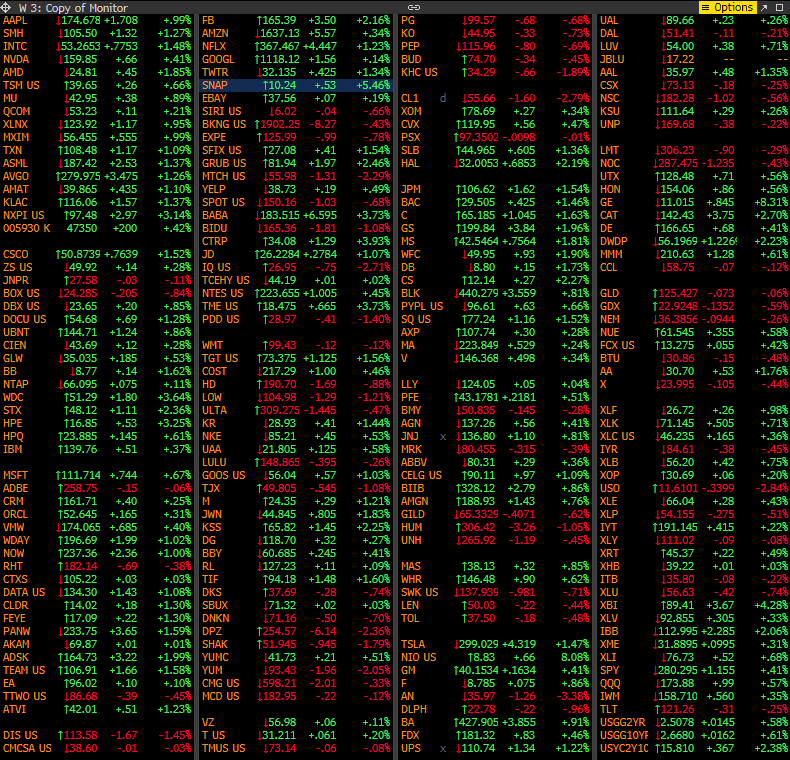
This morning, for the first time in a long time, I took a quick scan of the charts on my front page monitor on Bloomberg and found a number that caught my eye, in a sort of 1997 way…
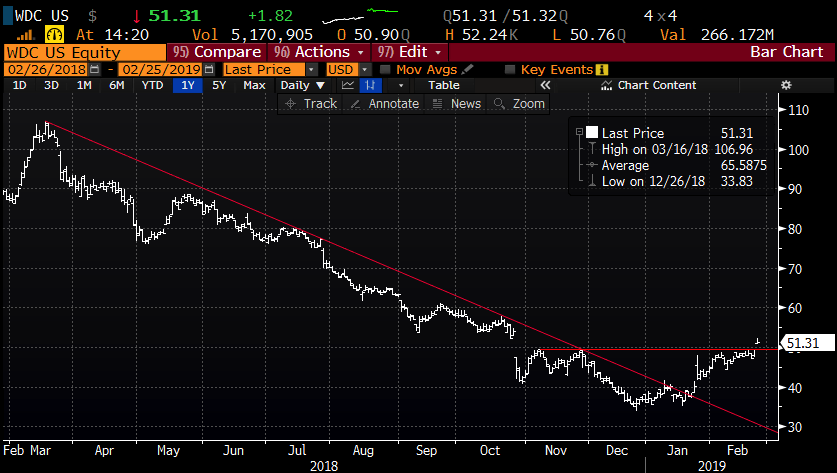
First, Western Digitial (WDC). Two things stick out to me, first, it broke the very well defined downtrend last month from its 2018 highs. Second, today’s gap places it above the late Oct breakdown level, as my friend, Chartist-extraordinaire from Cornerstone Macro Research likes to say, this would be a classic bearish to bullish reversal if it were to fill in the Oct gap and stay above $50:
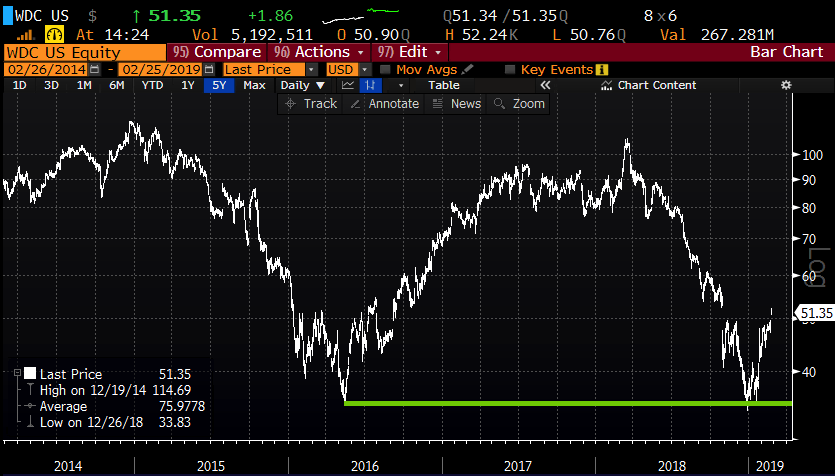
The five-year chart shows a fairly obvious double bottom near $35, but it’s important to note the stock has come a long way in a very short time:
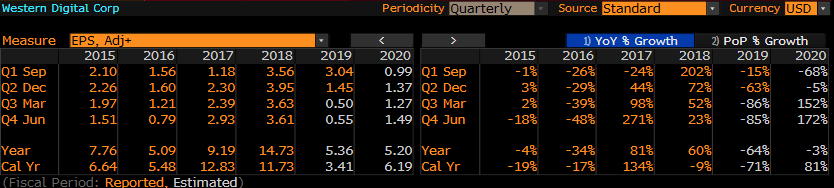
The next identifiable catalyst for WDC will be a presentation at Morgan Stanley’s TMT conference on Feb 28th and then their Q1 results the last week of April, which is a long ways away. Analysts are generally downbeat on the stock with 12 Buy ratings, 15 Holds and 2 Sells, while short interest at 7% of the float. The stock trades at 9x earnings because their earnings and sales are so volatile, with fiscal 2018 eps of $14.73 expected to drop to $5.35 this year, with sales expected to go from a record at $20.65 billion to $16.65 billion this year. You get the point.
The balance sheet is a bit lof a mess, with $10.6 billion in debt, relative to their $4 billion in cash on a $15 billion market cap… All this after WDC bought flash memory maker Sandisk in 2015 for $19 billion in cash and stock…. yuck. This is just messy enough to keep an eye on, any sort of fundamental shift that leads to improved sentiment and this might be an interesting setup.
Another that caught my eye, first because I saw Friday that they would be featured on last nights 60 Minutes on CBS was NIO, a Chinese electric car maker that went public last year on the NYSE. Since its initial post IPO pop, the stock has spent the last 5 months trading between $6 and $8, until today’s breakout.
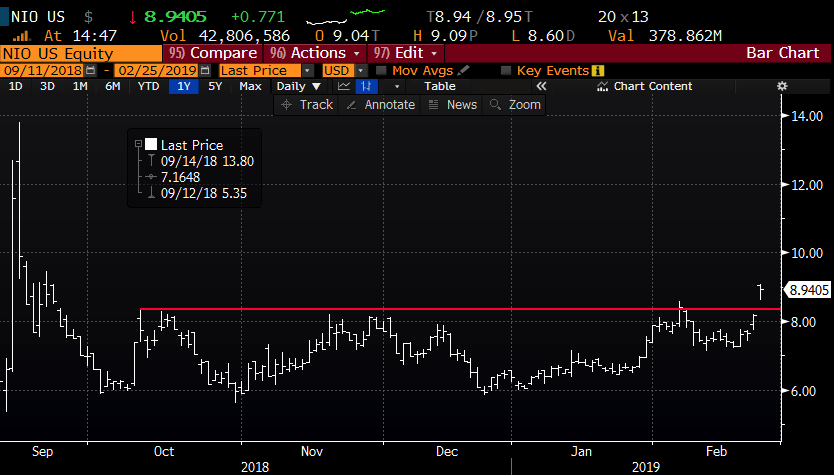
This company shipped only 10,000 cars last year in China, vs Tesla shipping 245,000 cars last year globally, but watch the clip, and you quickly get the sense that NIO could have the pole position in China for a whole host of reasons. With a $9 billion market cap, about one-fifth of Tesla’s $52 billion, and only expected to have about one-tenth of Tesla’s $28 billion in sales in 2019, and you can quickly see who investors might take a punt on the “Tesla of China” given their embedded advantages in what will the largest market for electric vehicles in the world forever.
And lastly an example of potential exhaustion after a very large move back to the prior highs in Nike (NKE), which I wrote a post on the week before last (read here).
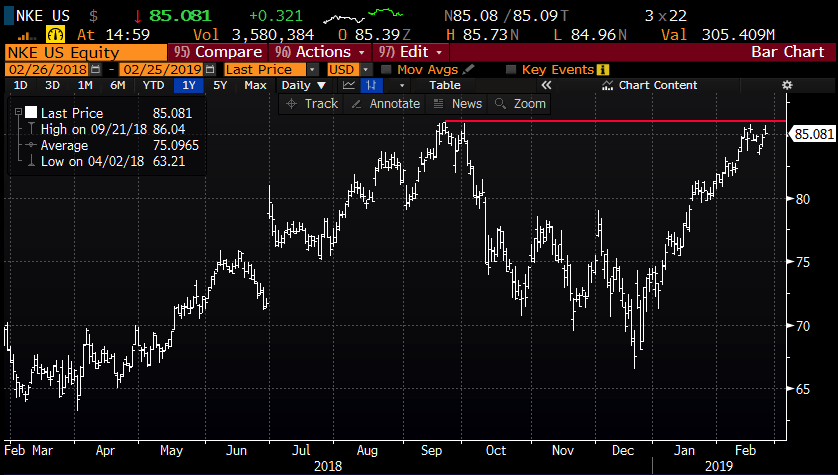
My take then, and it has not changed is that clearly a trade deal with China would be a perceived positive, much of the news might be priced in at current levels and when the company reports earnings on March 21st, much of that good news might be priced into the stock, especially if it is able to hold up in the mid $80s. This is the sort of trade we would prefer to be short via long premium, puts or put spreads, risking what we are willing to lose, as the stock is clearly hanging around the rim so to speak near the prior high. But the news to cause a meaningful breakout would have to be much better than any news that would ause the stock to decline back towards $80.