Boeing (BA) will report Q2 results tomorrow before the open. The options market is implying about a 4% one day move, which is rich to the average over the last four quarters of about 5.5% and well above the ten year average of about 3.2%.
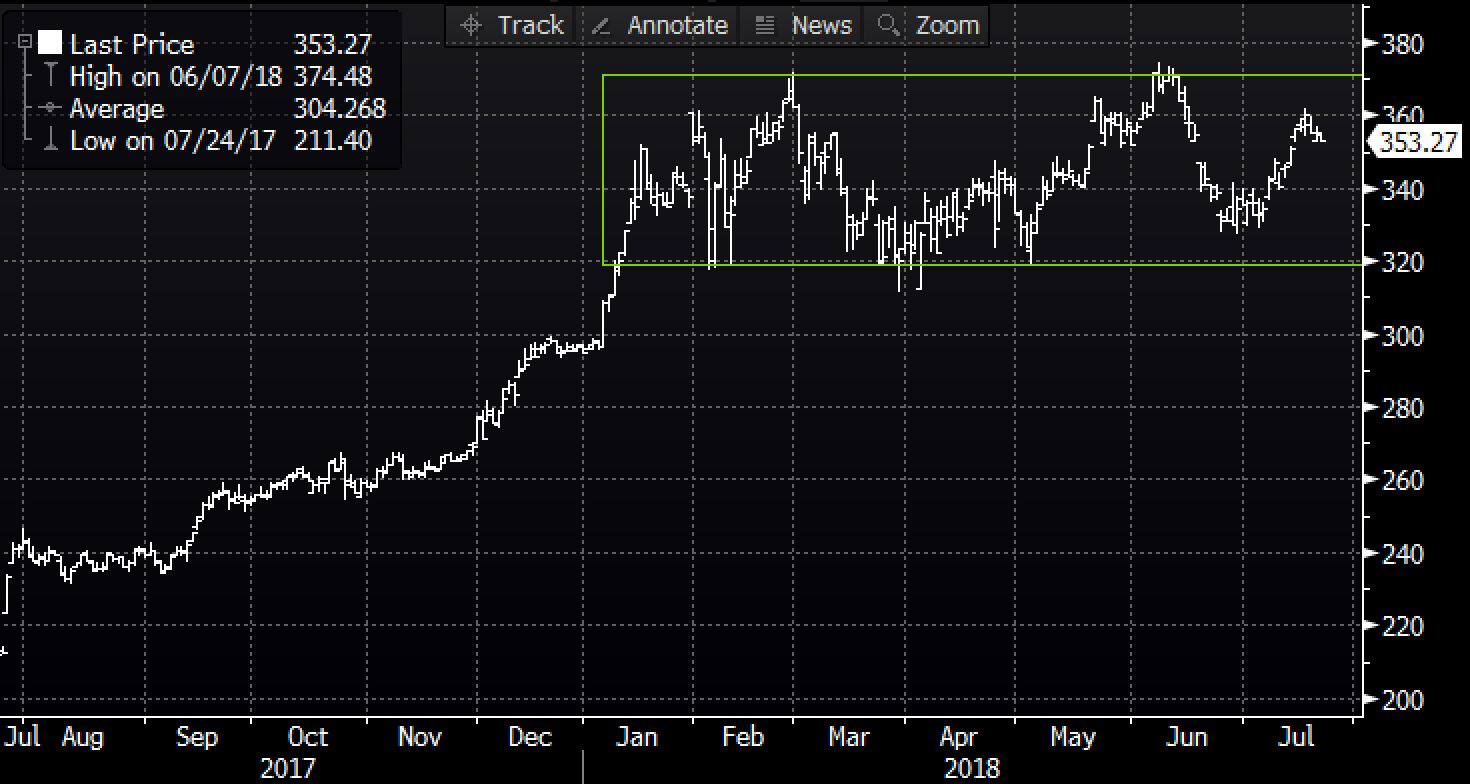
Shares of BA are up about 21% on the year, massively outperforming the S&P 500 (SPX) which is up 5% and the Industrial Select etf (XLI, of which it is the largest component at 8.5%), which is basically flat on the year. Since its ramp in January, and despite,two new highs since in February and June the stock has been in a bit of a holding pattern between $320ish and $360ish:
Wall Street analyst remain fairly bullish on the stock with two times as many analysts rating the stock a Buy vs a Hold (20 vs 10) and no Sell ratings with an average 12-month price target of about $400.
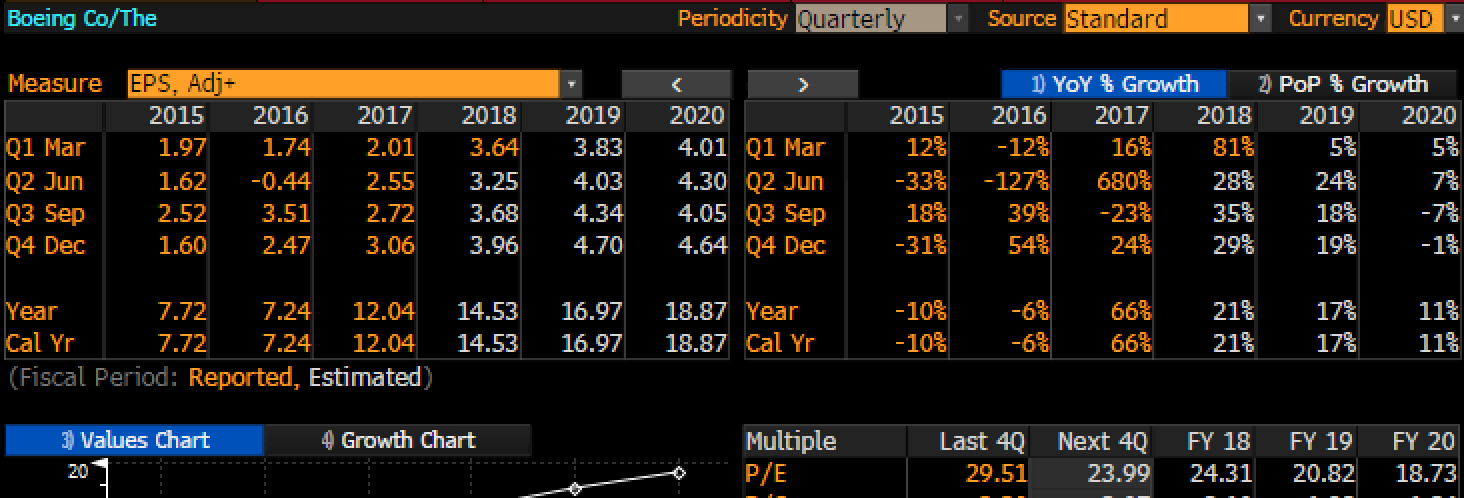
Shares of BA trade about 24x current estimates eps growth of about 21% and about 20x expected next year eps growth of 17% on about 5% sales growth. Not exactly expensive relative to growth, per Bloomberg:
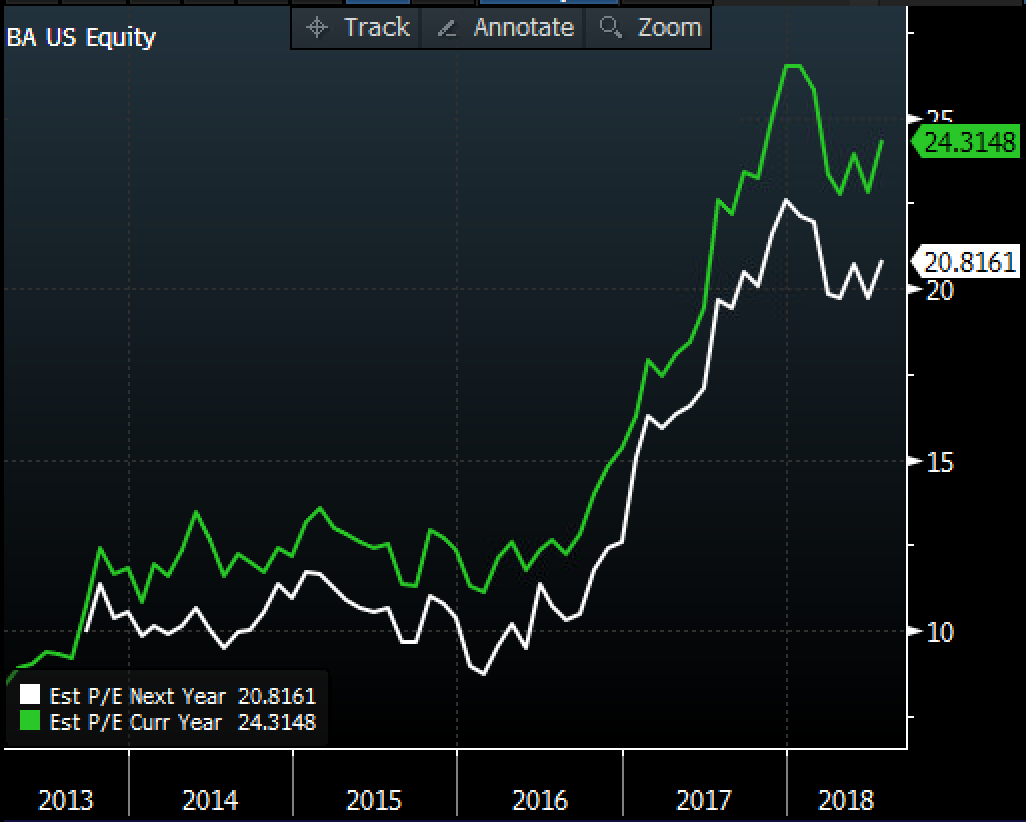
It is worth noting that in the early stages of the economic recovery post the financial crisis BA was a stock that traded at or below a market multiple, at this point it is trading rich to the market, its peers and its own history:
Its kind of a tale of two cities with Industrial stocks this morning, Lockheed Martin (LMT) was up nearly 3% on the open but is now down after raising its earnings guidance, while MMM (previewed yesterday) open down a few percent after lowering its guidance for its second consecutive quarter but is now up. The takeaway might be simple, this group faces no shortage of near-term headwinds given the uncertainty in Washington on the geopolitical. trade and currency fronts. BA gets 55% of its sales from overseas and despite massive backlogs for orders the recent 4.5% rally in the U.S. dollar and the brewing trade war might very well curb management’s enthusiasm as it relates to forward guidance.
SO what’s the trade?
One way to play for a move less than expected with an inclination lower would be with a put calendar targeting the implied move.
Trade Idea: BA ($356.20) Buy July 27th / Aug 342.50 put calendar for $3
-Sell to open 1 July 27th weekly 342.50 put at 1.90
-Buy to open 1 Aug 342.50 put for 4.90
Break-even on July 27th expiration:
If the stock is 342.50 or higher the short July 27th put will expire worthless, reducing the cost of the long Aug 342.50 put. If the stock is lower than current levels, the decline in value of the Aug put should be offset by an increase in deltas resulting from the price movement lower and the premium received for the short July put.
If the stock is higher than the short July put will expire worthless, the long Aug put will lose value, but depending on how much higher the July put premium could offset lost value in Aug.
Max premium at risk is $3, or less than 1% can only be a total loss if the stock is significantly higher than current levels or well below the strikes.
Rationale: this trade idea leans short, but and could be worth 1-2x the premium at risk if the stock is near the implied move to the downside.
FOR THOSE WHO THINK THE STOCK COULD MAKE A NEW HIGH TO THE UPSIDE, THAN THE REVERSE TRADE STRUCTURE TARGETING THE IMPLIED MOVE OF ABOUT $14 WOULD MAKE SENSE FOR A CALL CALENDAR.
WHILE WE USUALLY OFFER OUR DISCLAIMER FOR LONG PREMIUM DIRECTIONAL TRADES INTO EVENTS LIKE EARNINGS,AS GETTING DIRECTION RIGHT IS IMPERATIVE MOST OF THE TIME FOR SUCCESS, THIS TRADE IDEA HAS MORE OPTIONALITY.