I often get asked the importance, or my reliance on technical analysis when it comes to investing / trading. My answer has been fairly consistent for nearly two decades, charts serve as an input to a broader thesis that is usually based on fundamentals, whether that be a catalyst like earnings or a product cycle, or merely relative value. When I started out in the business I had a very poor grasp of fundamentals, and the firm that I worked at had all of their young traders take a class on technical analysis to be cognizant of momentum indicators and the like. At the time I didn’t know what I didn’t know, and I was more interested in learning about why stocks moved than trying to guess what a picture might suggest where a stock would go next. To be frank, fundamentals, technicals, all of it, involves a bit of guesswork, but where I am fairly well convicted on the use of technicals is in choosing strikes for options trades. I am a strong believer in the tension that exists in well-established support and resistance which often times can be very helpful in establishing the short strike of a vertical spread. And options volume around those technical levels often become self fulfilling prophesies.
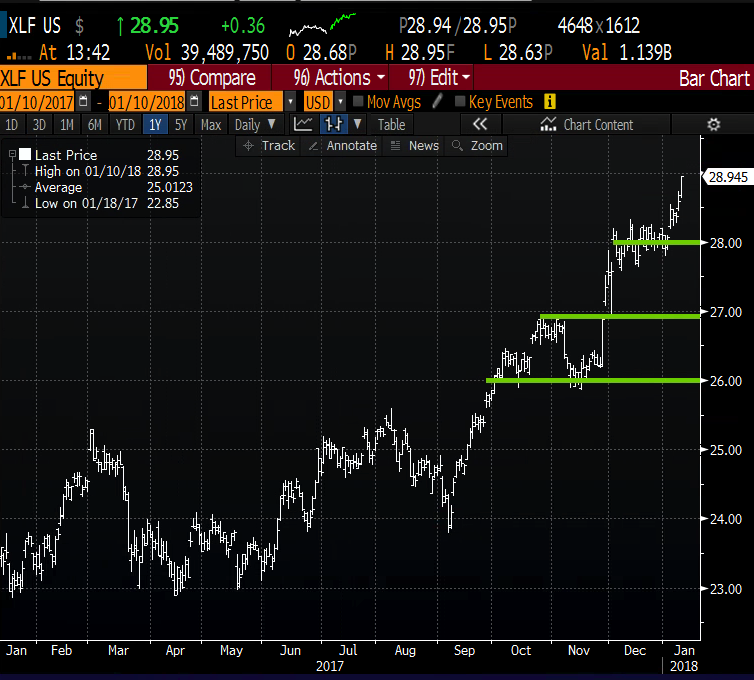
A good example of this was the trade ideas I laid out the other day in the XLF over three durations (read here). Each trade idea was targeting one of the support levels below (that also happened to be bunched around round numbers and corresponding options strikes):
Some traders rely on support and resistance levels as entry points on trades. Often times traders who place heavy emphasis on technical analysis believe that the charts foretell fundamental news. This might be the case in Dominoes Pizza (DPZ) which just the other day broke out above a downtrend (a series of lower highs and lower lows) that had been in place since the stock made all-times highs in June. But last night after the close, DPZ announced that their CEO, who orchestrated an epic corporate turnaround, was stepping down. The stock is down 4% today:
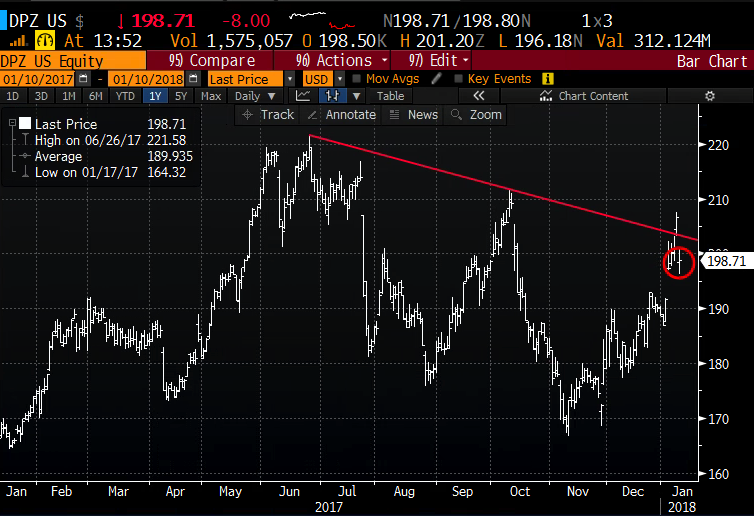
What’s clear here is that investors view this news as negative, and despite the brief breakout, the failure at clear resistance might suggest a move back towards the lower bounds of the downtrend.
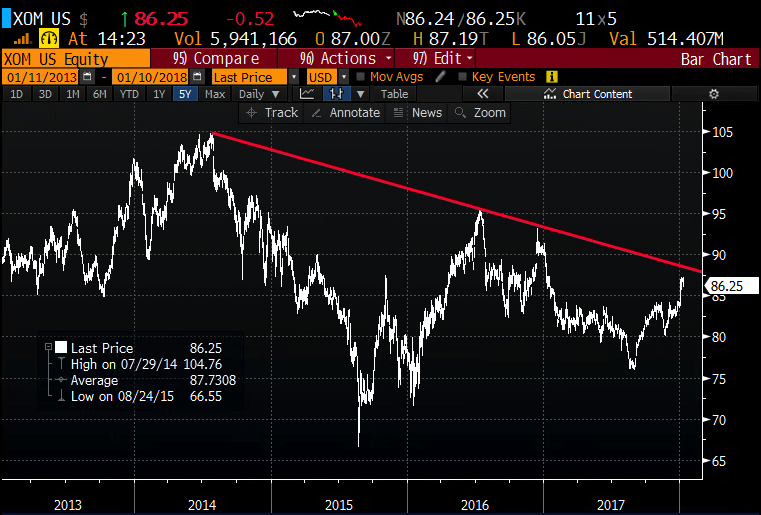
Another chart that I just saw, that I have no fundamental opinion on was Exxon (XOM), but over a longer period of time. Look back to its all-time highs made in 2014, the stock is very near the long-term downtrend, which could serve as formidable technical resistance:
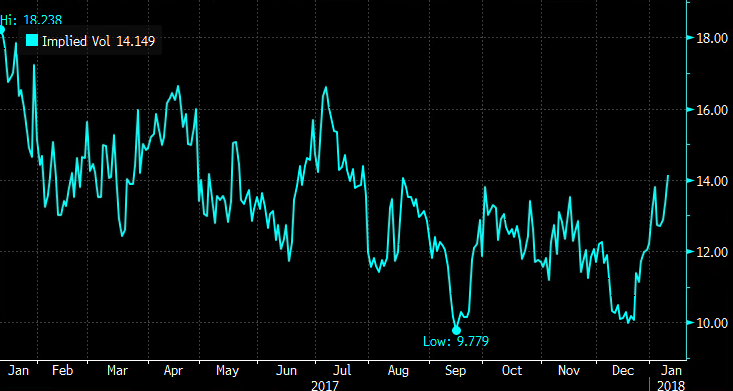
Let’s assume the chart was the first input, and I could then develop a fundamental thesis, possibly related to the company’s Q4 earnings confirmed for Feb 2nd. I would then take a look at the options market, see what the implied move is, and how options prices are shaping up. XOM is not historically a big mover on earnings, about 1.6% average one day move over the last few years. The options market is implying about a $2.50 move between now and the close on Feb 2nd, or about 3% between now and then, or double the one day implied movement. Short-dated options prices are therefore elevated into the print, with 30 day at the money implied volatility at 14%, up from 10% and in a nearly a straight line since mid-December:
So let’s assume that the stock’s recent pop already incorporates possible good news on earnings. If that’s the case and I wanted to set up a near-term defined risk bearish trade into the print, then the five-year chart supports a short entry near the downtrend. And the one year chart shows support on any pullback near $84, a level that served as mighty technical resistance from February 2017 to just last week:
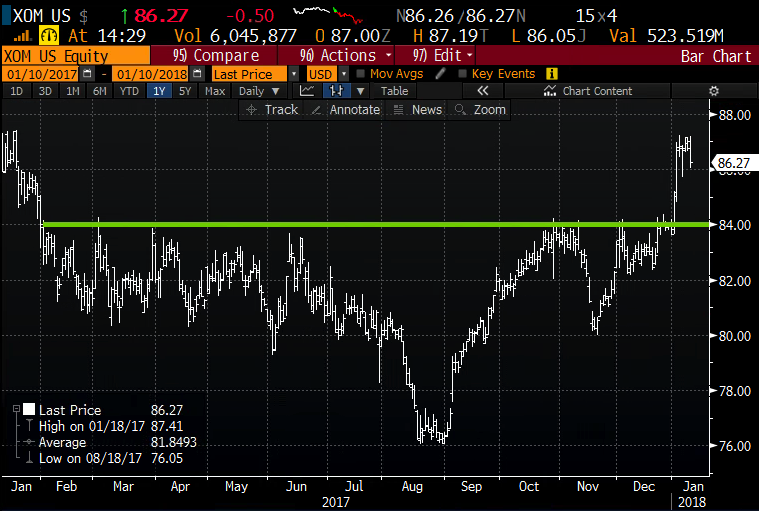
So what’s the trade? elevated implied vol suggests directional players use spreads, the five-year charts supports a short entry at long-term resistance just below $87, while the one-year chart shows good support at $84 which should serve as the short strike of a put spread.
Trade Idea: XOM ($86.25) Buy Feb 2nd weekly 86 / 84 put spread for 60 cents
- Buy to open 1 Feb2 86 put for 1.08
- Sell to open 1 Feb2nd 84 put at 48 cents
Break-even on Feb 2nd weekly expiration:
Profits of up to 1.40 if XOM is between 85.40 and 84 with a max profit of 1.40 at 84 or lower.
Losses of up to 60 cents between 85.40 and 86 with max loss of 60 cents above 86.
Rationale: Obviously by reading this note I have no fundamental view on the stock, but if I were just using technical as the primary inputs it might support a bearish trade into earnings playing for a failure at long-term resistance and retracement back to support at $84. This trade idea risks less than 1% of the stock price, but it is a low risk, low reward trade, risk 1 to possibly make a little more than 2 with a breakeven down 1%.
Of course the disclaimer is, as we like to say for long premium directional trades into events, you need to get a lot of things right to just breakeven, magnitude of the move, direction and timing.