Last week in this space we discussed broader volatility measures like the spot VIX, VIX futures and vol ETNs like VIX and VXX as a broader conversation on volatility as an asset class. In case you missed that you can read here: Volatile Compounds (VIX, XIV, VXX, VIX Futures)
Today I wanted to go less macro and more micro in discussing vol and talk about implied volatility as it relates to individual stocks (and a couple of mistakes traders make when discussing).
I’m going to start off with a chart of Apple (AAPL) 30 day implied volatility, with earnings dates indicated by Blue E:
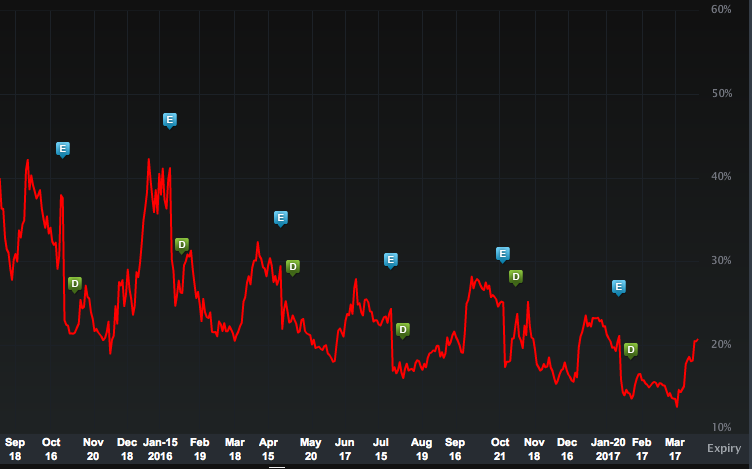
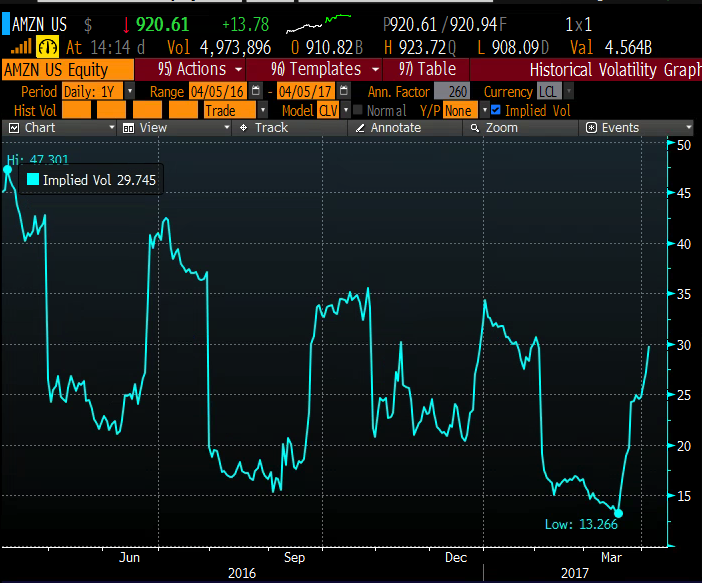
You’ll notice a trend, implied volatility moves higher into the event, and drops the day after. Here’s the same pattern in Amazon (AMZN):
The short cut that is generally used here when discussing this effect is that vol is rising into the event. In a general sense of the chart it is. But not necessarily in the simple way traders often refer (we take this shortcut on the site sometimes).
To understand what’s really going on you have to know how 30 day implied vol is calculated, and then represented on the charts above. 30 day implied vol is a rolling blend of at the money options looking out 30 days. Why that matters to trading is by looking out 30days, those charts are somewhat misleading and don’t tell the entire story.
In particular, look at the uptick over the past 2 weeks. Is volatility in Apple and Amazon rising right now? The chart says it is, But in reality, not really. What’s happening is the May options are becoming more heavily weighted in the calculation, and they have a much higher volatility to start with than the April options, which are becoming less weighted each day. And why the skew between April and May expiration? Both companies report earnings after April expiration, with May options capturing both.
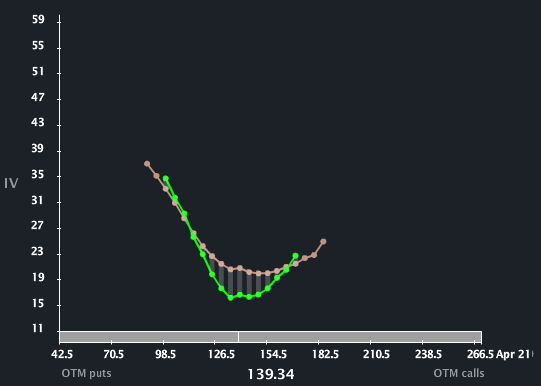
So the chart can give a false sense of what is going on in the options market as it seems like vol is rising. There’s an interesting tool on LiveVol Pro that shows you want has actually happened over the past month with April and May vol in AAPL. Here’s the snapshot from March 6th, the green line shows April options, the beige line May. Pay attention to the lowest point in the curve, that’s at-the-money options:
And here is the snapshot from today:
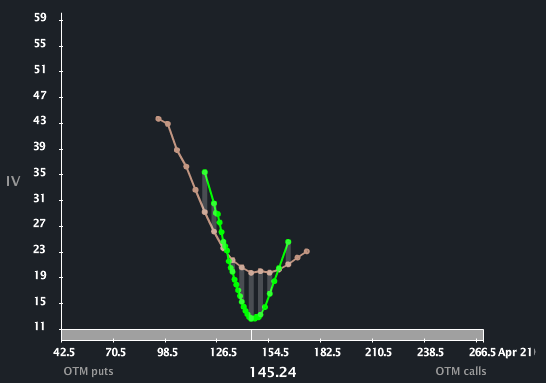
Basically, May at the money vol hasn’t moved one inch while April dropped precipitously. (the tails of the curve represent out of the money skew, I’ll save that for another post)
So you’ll hear most people refer to the IV chart at the beginning of this post and say that “vol is rising into earnings”. But in this case, the vol that captures earnings isn’t really doing anything. And the options that expire before earnings are actually getting killed!
This is important from a trading perspective because it’s a good policy to buy options into events when vol is low (e.g. hedges), and sell options when vol is high (over-writes, strangles etc). But a closer look reveals that May is neither high nor low from where it was a month ago, while an implied vol chart could give that impression.
Implied vol that captures earnings can go a lot higher into an earnings event, especially when the expiration is days after the event, as market makers need to keep the straddle (implied move) from decaying and becoming too cheap. And certainly the vol crush after the event is very real. But you have to look more closely at that month’s volatility and how it itself has moved, apart from rolling 30 day average, to get a sense if vol is rising (or falling!) into an event. That’s the best representation of uncertainty and fear (or lack thereof).
The best use of the IV30 charts at the beginning of this post is to see how this earnings stacks up with previous ones. That gives a good sense of implied moves on an event versus ones in the recent past, something we speak to on every earnings preview here on the site. Another useful trading tool is comparing implied vol to what the stock is actually doing (realized vol) and what that means for long and short premium trades. I’ll detail that in a later post.