In the past month, I’ve seen many variations of the following 2 charts, comparing the performance in the S&P 500 in 2013 to the start of 2012 and 2011. Here are the 2 charts, courtesy …
Continue readingSurprise Index
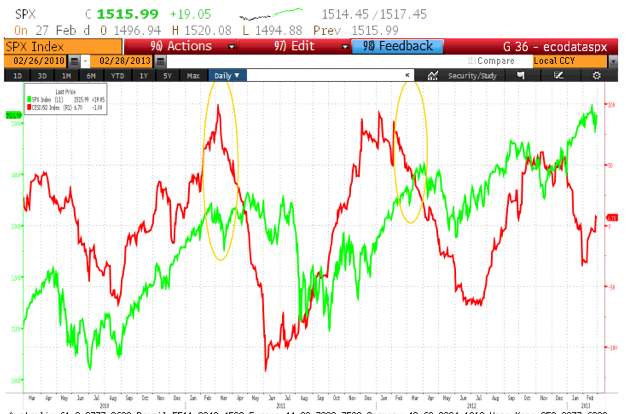
The Citigroup Surprise Index for the U.S. measures macroeconomic data vs. expectations. When the economic data is coming in much better than expected, you’ll see a strongly positive number for the Surprise Index, and a …
Continue reading