Today after the close IBM will report its Q2 earnings. The options market is implying about a $7 or 5.5% post-earnings move tomorrow vs its ~4% average one-day move over the last four quarters.
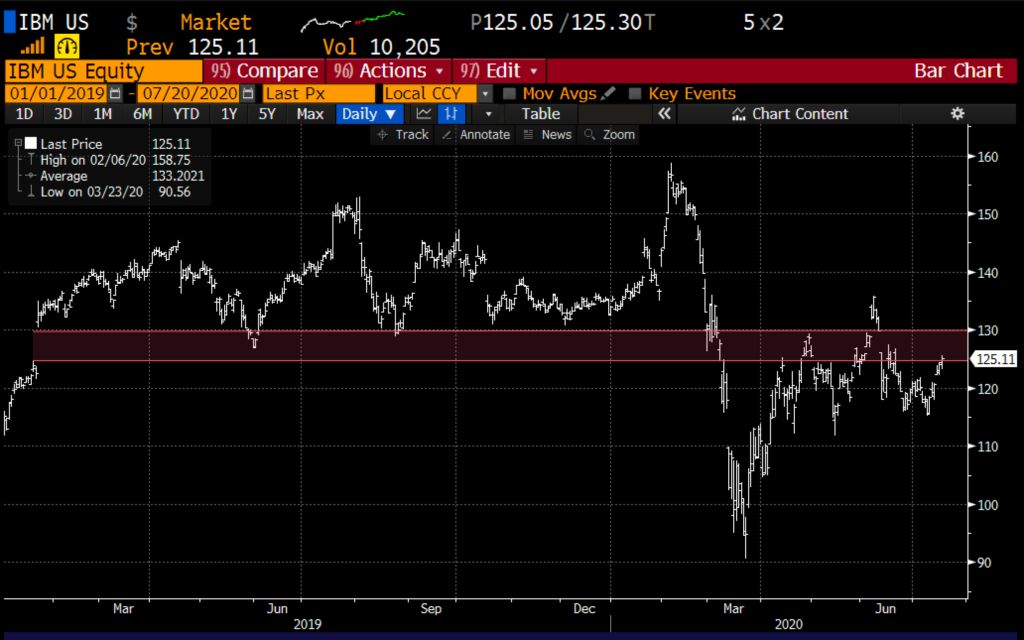
Shares of IBM have underperformed much of its large-cap peers and the broad market, down 6.5% on the year and down 21% from its 52-week highs made in February. The 18-month stock chart below has a sort of “holding on for dear life” feel to it, with considerable technical resistance between $125 & $130:
Sentiment towards the stock remains very poor with only 5 Buy ratings from Wall Street analysts, 13 Holds and 2 Sells with an average 12-month price target among them of about $126.50, very near where the stock is trading. The high target on the street is Credit Suisse’s Matthew Cabral at $150 who in a preview note to clients last week offered a hint of cautious optimism as the company under a new CEO shifts its focus:
We continue to expect a challenging Enterprise spending backdrop in 2H, as IT budgets are increasingly under pressure against a tough macro; however, we think 2Q marks a trough in terms of IBM’s rev/EPS trajectory and like the renewed emphasis on LT growth vs. NT profitability by new CEO Arvind Krishna that should allow the company to emerge stronger post-COVID-19. We firmly believe
IBM + Red Hat solidifies positioning in the accelerating push toward hybrid cloud, with a leading next-gen platform (OpenShift) while leveraging both the incumbency and expertise of core IBM to help modernize the 70-80% of apps still on-prem.
My take into the print, I see little that they can say about the current environment as it relates to enterprise demand that will get investors excited and their lack of visibility on their transformation to the hybrid cloud will be a reason for investors to wait on the sidelines imo.
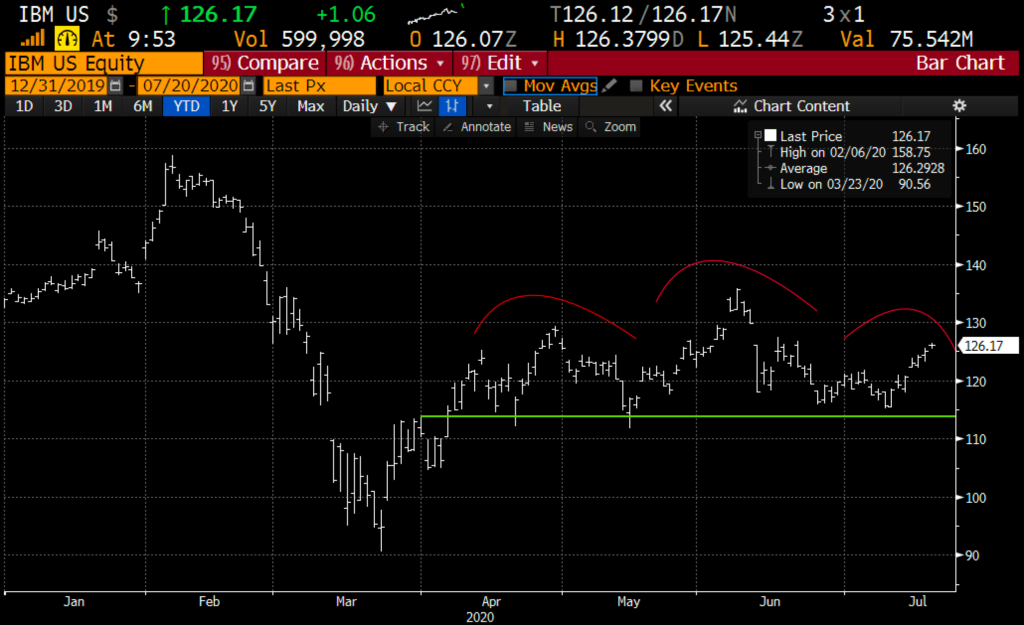
The year to date chart has a sort of head and shoulders top feel to it with the neckline near $115:
SO what’s the trade?
If I were inclined to play for a move back to support or below I might consider the following put spread in August expiration:
Bearish Trade Idea: IBM ($126) Buy Aug 123 – 110 put spread for $3
-Buy to open 1 Aug 123 put for $4.10
-Sell to open 1 Aug 110 put at $1.10
Break-even on Aug expiration:
Profits of up to 10 between 120 and 110 with max gain of 10 below 110
Losses of up to 3 between 120 and 123 with max loss of 3 above 123
Rationale: this trade idea risks 2.4% of the stock price, has a break-even down 6%, a little more than the implied earnings move and has profit potential of up to 8% of the stock price, or 3x the premium at risk if the stock is down 12.5% in a month.
OR
IF like the Credit Suisse analyst I thought Q2 would mark a near term trough and that the company is set up to be re-rated in late Q3/Q4 then I might consider a call calendar, targeting the implied earnings move… for instance:
Bullish Trade Idea: IBM ($126) Buy Aug – Dec 135 call calendar for $3.75
-Sell to open 1 Aug 135 call at $1.25
-Buy to open 1 Dec 135 call for $5
Break-even on Aug expiration:
the ideal scenario is that the stock is just below 135 on Aug expiration and the short call will expire worthless or can be covered for a small amount while the long Dec 135 call has picked up deltas gaining in value and I am left long the longer-dated call for what I hope to be a move higher back towards the 2020 highs above 150. The idea is to sell some short-dated out of the money premium to help finance the purchase of longer-dated premium to allow for the big move to play out over more time.