On October 23rd, the day following 3M’s (MMM) Q3 results the stock sold off 4.4% on disappointing results and guidance, citing the adverse effects of a strong dollar and higher input costs which weighed on both sales and earnings, per Bloomberg:
The company cut its 2018 profit forecast Tuesday to no more than $10 a share, short of even the lowest analyst estimate in a Bloomberg survey. That was the third time this year that the maker of Post-it notes and touch screens has trimmed its outlook.
The diminished outlook underscored the weakness in many of the markets served by 3M, which had already been struggling this year with poor sales of automotive and dental products. Revenue fell for the first time in two years, with declines in three of the company’s five main businesses during the third quarter: electronics and energy, health care and consumer products. “Results were weaker than expected, with each segment missing our forecast,’’
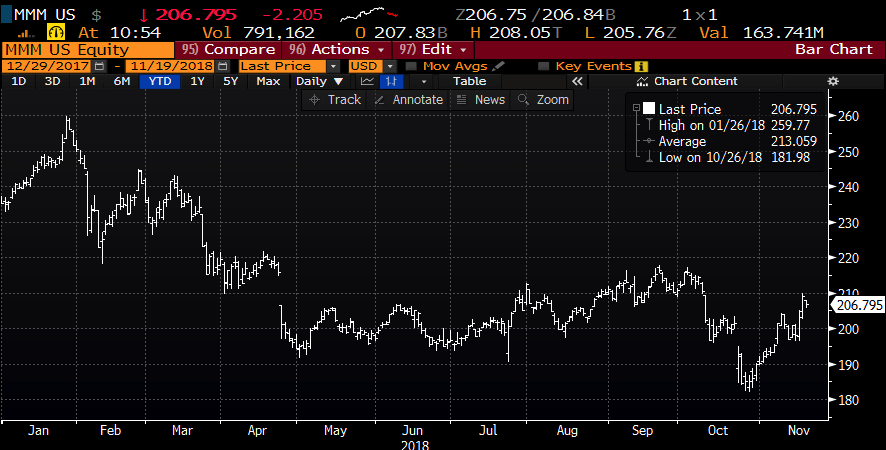
The fundamental outlook was less than pretty, and the one-day decline post results sent the stock to a new 52-week low, placing the stock down nearly 30% from its 52-week and all-time highs made in late January:
Since bottoming out in the days after earnings, the stock has miraculously rallied 13%. despite the backdrop of volatile global equity markets and a U.S. Dollar that last week just made a new 18-month high before pulling back a touch:
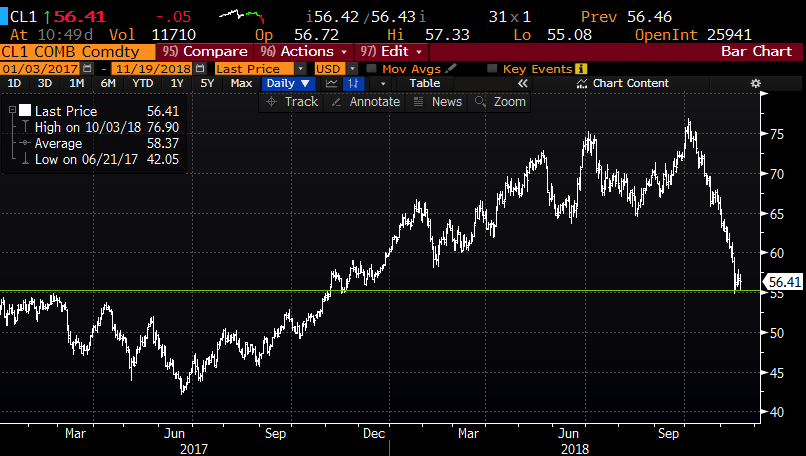
On potential boost for MMM’s stock rise might have been the total collapse in crude oil, a major input for MMM, and one of the very things weighing on their results and guidance. Since making four-year highs in early Oct, Crude as sold off 26% in what looks like a straight line, possibly finding a little technical support at $55, the breakout level from last November:
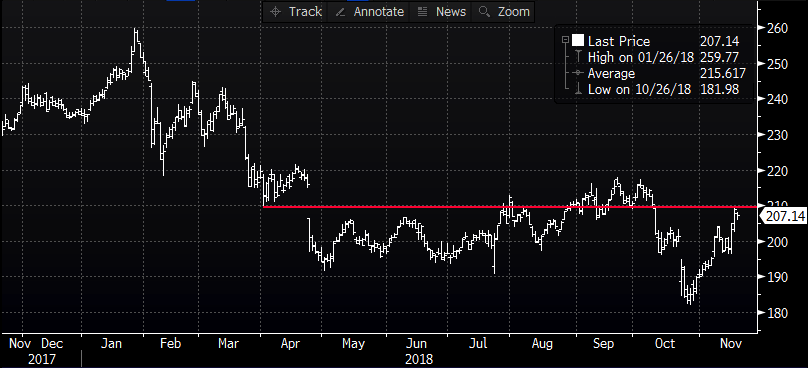
If crude were to rally back, and the dollar was to hold recent gains, investors might start to think once again about the difficulty for MMM to achieve the guidance that they gave last month. To my eye, the Q1 earnings gap of nearly 7% on disappointing results and guidance, below $210 appears to be formidable technical resistance:
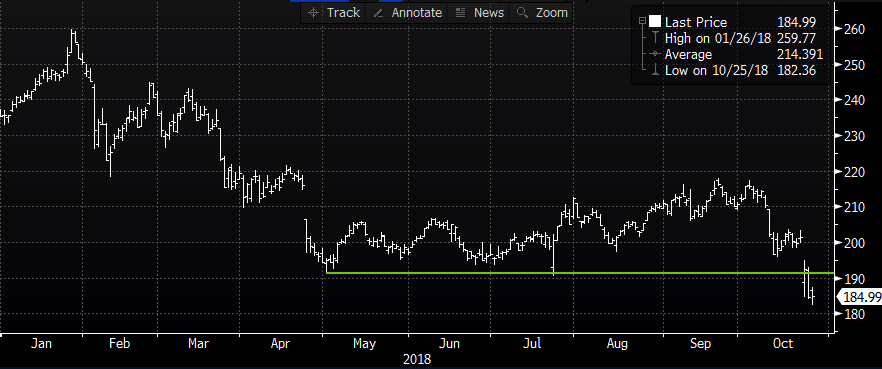
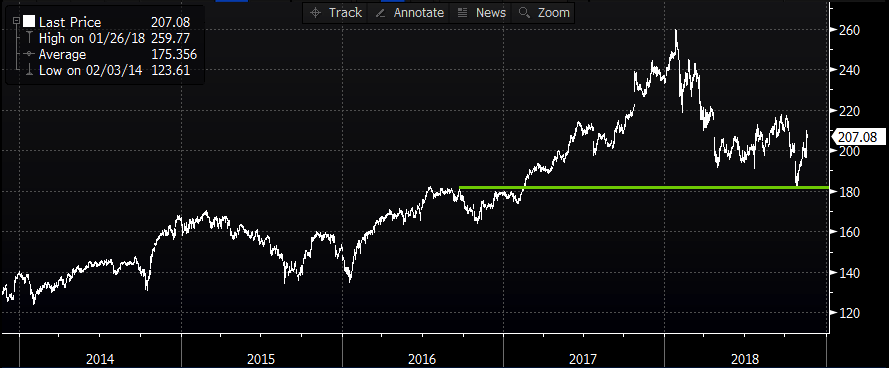
Ok, one last chart, last month’s bounce came at a pretty interesting spot, near $182, which was the early 2017 breakout level, which should serve as decent near-term technical support but also a bit of a bulls-eye on any further broad market weakness or stock specific news on their upcoming Qearningsns in late July:
So what’s the trade? If I were inclined to play for a re-test of last month’s lows. I might look to do so with put spreads targeting year-end… for instance:
Bearish Trade Idea: MMM ($207) Buy Dec 28th (weekly) 205 / 185 put spread for $4.25
-Buy to open 1 Dec 28th 205 put for 5.25
-Sell to open 1 Dec 28th 185 put at 1
Break-even on Dec 28th expiration:
Profits of up to $15.75 between 200.75 and 185 with max gain of 15.75 at 185 or lower.
Losses of up to 4.25 between 200.75 and 205 with max loss of 4.25 at 205 or higher.
Rationale: this trade idea risks 2% of the stock price, for a break-even down 3% that the options market says has about a 35% probability of being in the money on Dec 28th. This trade idea offers an attractive risk-reward, risk 2% to possibly make up to 7.6% if the stock were to re-test levels it was trading at about a month ago.