Goldman Sachs (GS) will report their Q2 results tomorrow morning before the opening. The options market is implying about a $6.50 move in either direction between now and Friday’s close, or about 2.75%, most priced for tomorrow’s earnings reaction. The implied move is rich to its 4 qtr average one day post earnings move likely the result of the stock’s nearly 5% decline following its Q1 results in April.
Shares of GS are down on the year, about 4%, demonstrating massive underperformance to the S&P 500 which is up 10% and the XLF, the Financial Select etf which is up 8%. The stock has since recovered a bit from its post Q1 results lows, but is still down about 10% from its 52 week and all time highs made on March 1st:
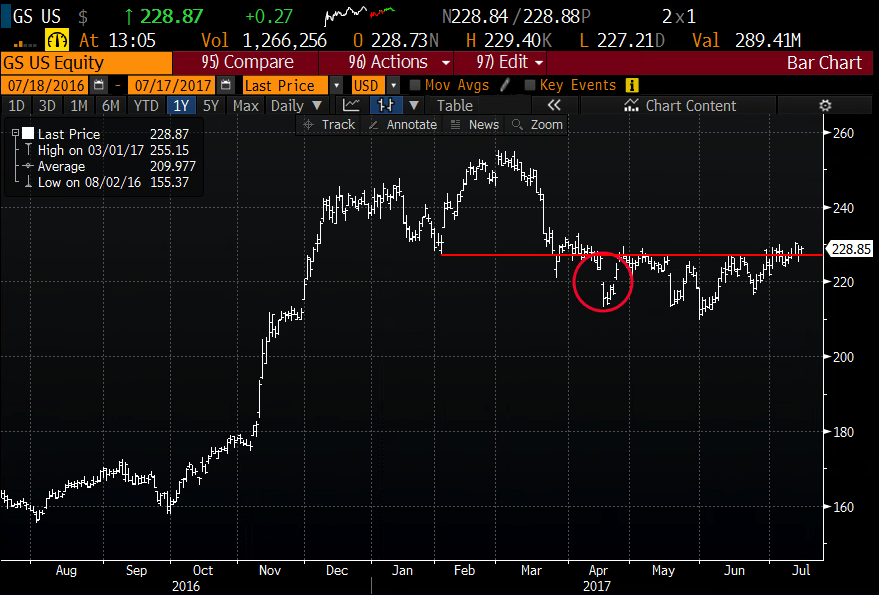
To my eye, the stock is teetering above an important technical spot, possibly precariously so.
Update – In late May we detailed a defined risk way to play for a round trip of most of the move since November (here), which was nearly an instant double a week later and we managed the idea by taking half off, or the cost of the trade (here). We now wanted to offer a new strategy for those he think that tomorrow’s results might disappoint again and the stock might rest the late may lows.
So What’s the Trade?
Defined Risk Bearish
GS (229.25) Buy the Sept 225/200 put spread for 4.85
- Buy 1 Sept 225 put for 5.70
- Sell 1 Sept 200 put at .85
Breakeven on Sept expiration – Gains below 220.15 with max gain of 20.15 at or below 200. Max loss of 4.85 above 225.
Rationale – This put spread defines risk for a move below 220, targeting 200 with a good risk reward profile. It’s biggest risk is a breakout from this consolidation on the report. But any move lower, even if small on the report sets the trade up nicely for any follow through later in the Summer.