Tesla (TSLA) is trading near $366 in the pre-market, down a few percent, after declining 10% yesterday and 5% on Tuesday. Their “battery day” was something investors viewed out of the Nikola (NKLA) hydrogen fuel cell playbook, basically, a lot of hype and investors didn’t buy it, they are actually selling it. I don’t have a strong view at the moment on the fundamentals of TSLA, the company appears to be doing most things right, and most of the issues that had plagued CEO Elon Musk in from 2017 to late last year seem to be in his rearview mirror. The company has raised a ton of cash in the last year shoring up its balance sheet and has apparently executed well in a global recession. Which is not what I would have expected.
Despite the stock trading down about 30% from its recent all-time highs, it is still up 350% on the year, sporting a ~$350 billion market cap.
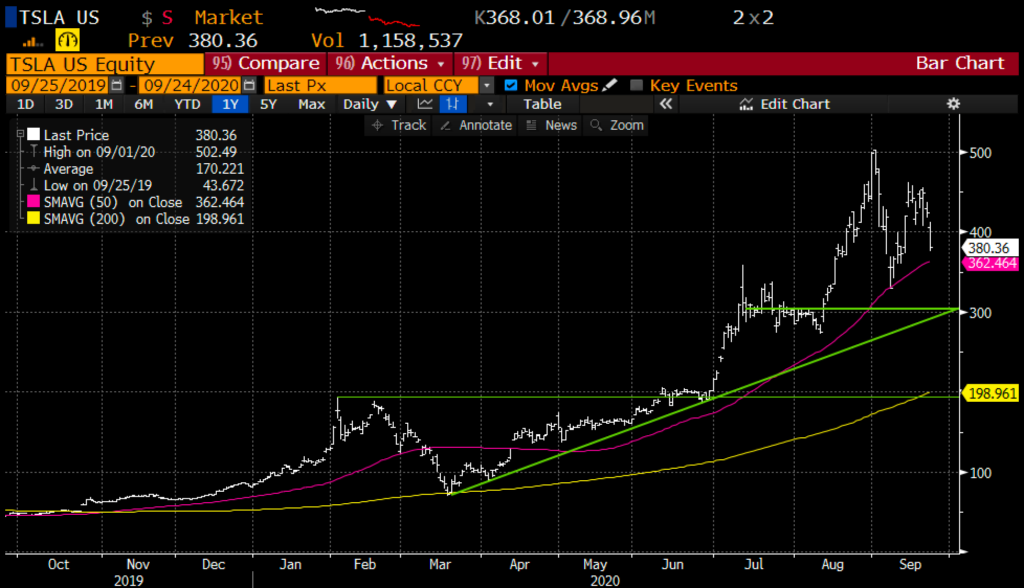
The chart below shows near-term technical support at its 50-day moving average around $362, next support at the intersection of its uptrend from the March lows and that little launch-pad area from July/early August around $300 with a massive air pocket down to the $200 breakout level which also happens to be its 200-day moving average:
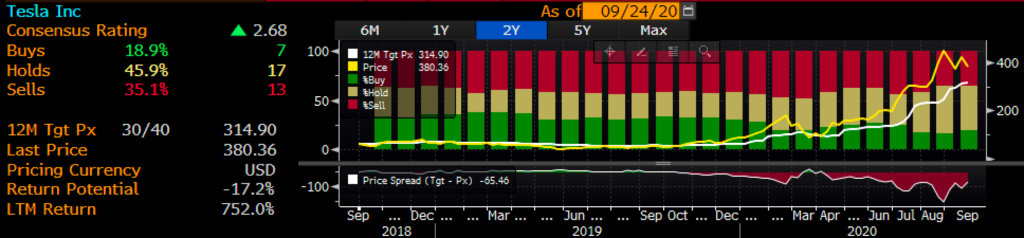
If you have been in this business long enough, or merely just follow the markets close enough you know how easy it can be wrong, and how when you are wrong about some situation that has the most fervent popular sentiment how much they can overshoot. In the case of TSLA, shorts have gotten absolutely decimated, and the Wall Street analyst community has not done too much better, with less than 20% of the 37 analysts who follow the stock rating it as a Buy. And looking at the Bloomberg data below you see that it’s not like a bunch of them have been downgrading the stock as it registered fabulous gains over the last year, they have mostly been on the sidelines with 35% of them suggesting to Sell the stock, a rarity on Wall Street:
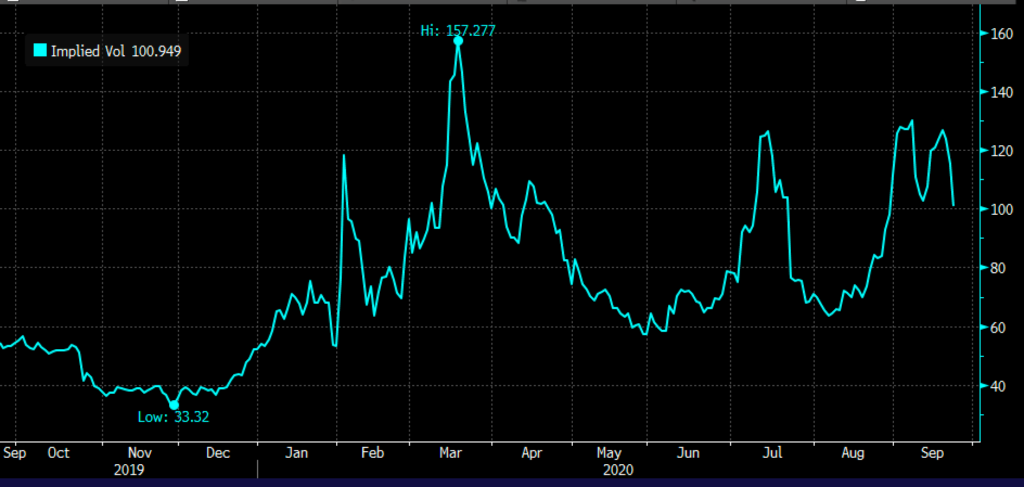
As one might expect, short-dated options prices reflect all of this angst in the investor, analyst and pundit classes, with 30-day at the money implied volatility near 100% implying daily movement of over 5%.
It is also worth noting the skew in the calls vs the puts, which is usually the other way around. For instance, on yesterday’s close of $380, the Nov expiration (nearly two months out) the 480 calls (up $100 from current levels) closed at $28.75, while the Nov 280 put closed at about $15, nearly half the cost of the equidistant call. This suggests that market makers are far more worried about extreme upside vs the potential of extreme downside near-term, which is also a function of supply vs demand.
This presents an unusual opportunity for long holders to hedge using zero-cost collars offering far closer downside protection from buying a protective put vs capping potential upside gains by selling an upside call.
For instance off of yesterday’s $380 close, vs 100 shares of TSLA long one could hedge with this zero-cost collar in Nov expiration:
vs 100 shares of TSLA long at $380 (yesterday’s close) Buy Nov 480 – 320 collar for even money
-Sell to open 1 Nov 480 call at $28.75
-Buy to open 1 Nov 320 put for $28.75
Break-even on Nov expiration:
Profits of the stock up to $480, up ~26%. If the stock is $480 or higher on Nov expiration 100 shares long would be called away vs 1 call short, but the investor could always cover the short call to keep the long stock position intact.
Losses of the stock down to $320, or ~16% with protection below.
Rationale: again, the skew towards calls offers a very unusual opportunity for long holders to hedge, while allowing for far more potential upside using a collar.