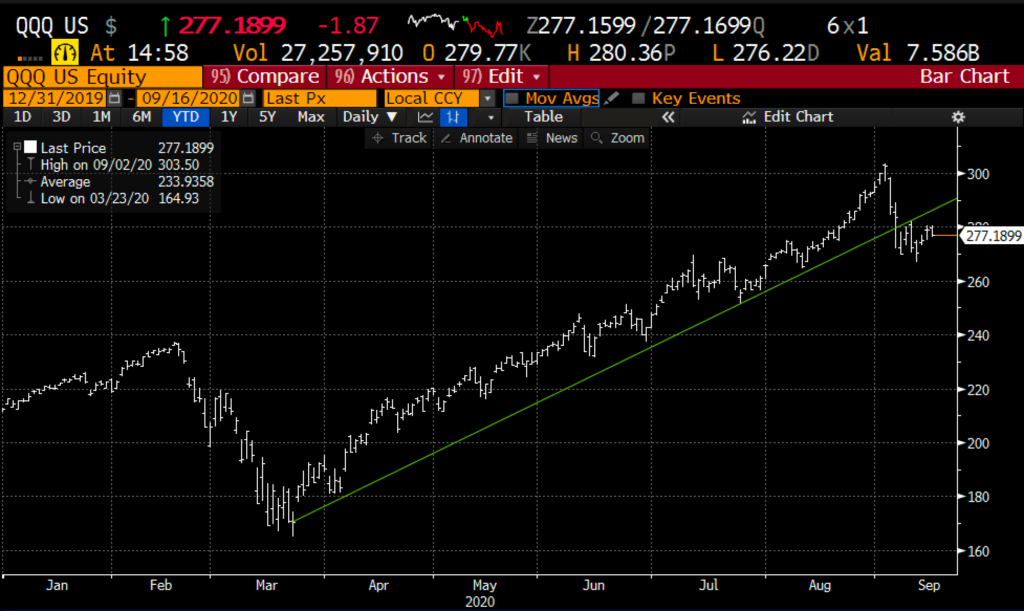
The Nasdaq 100 (QQQ) had an epic month in August, rallying more than 12% seemingly making new daily highs. Many market participants, including myself, felt like this was a bit of a blow-off top, but found it increasingly impossible to pick a top. September has had a very different feel though, from the Sept 2nd highs to last week’s lows the QQQ sold off close to 11% with its biggest gainers and largest components leading the way on the downside, breaking the uptrend that has been in place since the March lows.
You know the drill here, MSFT, AAPL, GOOGL, AMZN, FB & TSLA make up nearly 50% of the weight of the Nasdaq 100. As we head into Q3 earnings in October, investors may start to become a bit more measured on 2021 valuations as these companies may see some margin pressure as they deal with higher costs associated with the pandemic. But this post is not about intermediate-term fundamentals, but about technicals.
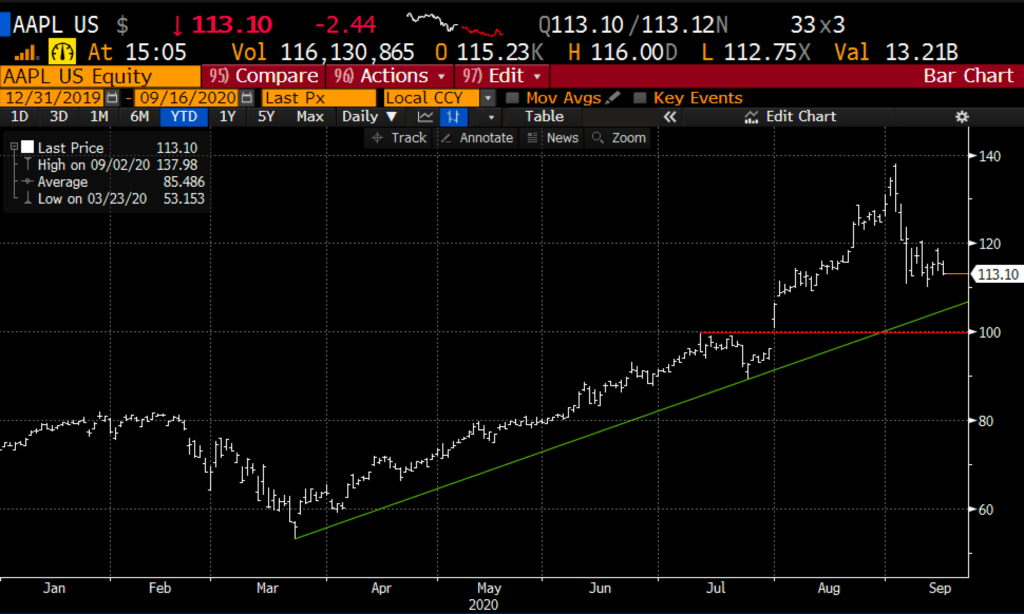
AAPL had its product announcement and not a single thing that was unexpected came out yet some were still expecting a 5G iPhone to be announced, which now looks like an October announcement. The stock looks like it wants to roundtrip its entire move from its last earnings report near $100 – $95 area:
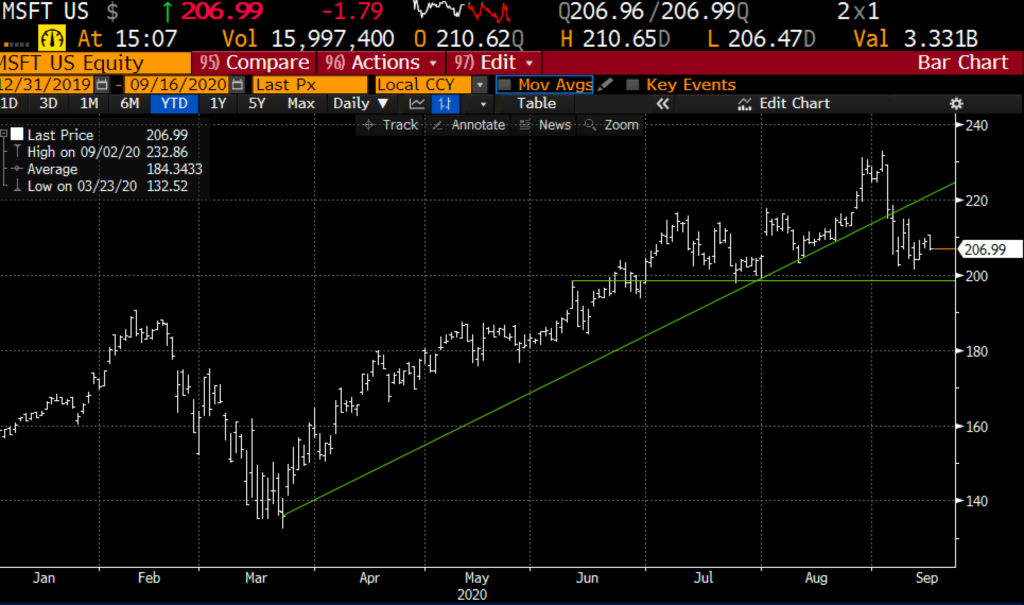
MSFT is below its uptrend from the March lows, but has near-term support around $200:
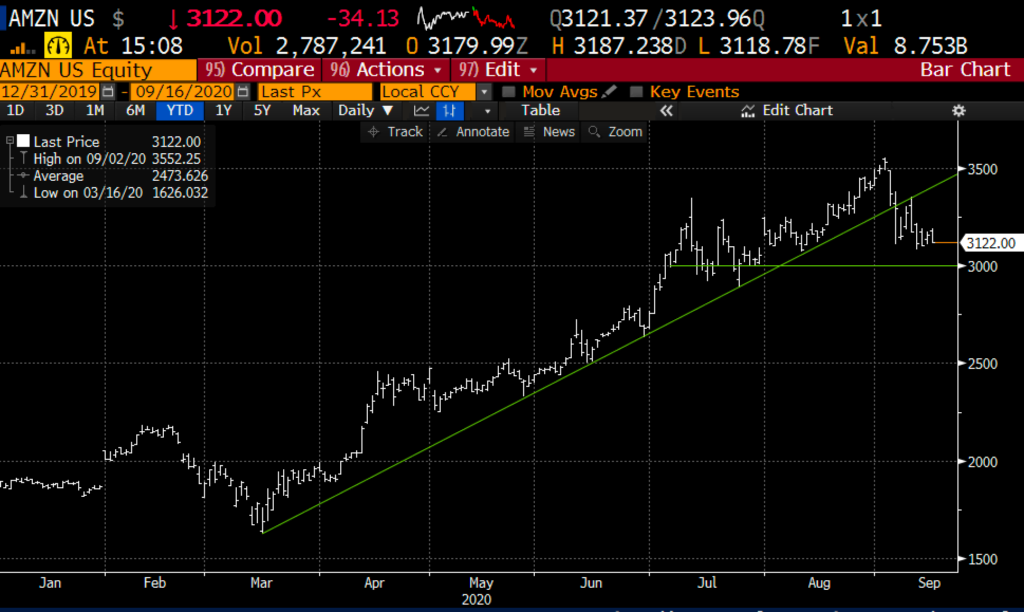
AMZN has a very similar look and feel to the chart above, but up 69% on the year vs MSFT’s 31% ytd gains, it is clearly a bit more extended in both performance and valuation, with near-term support near $3000:
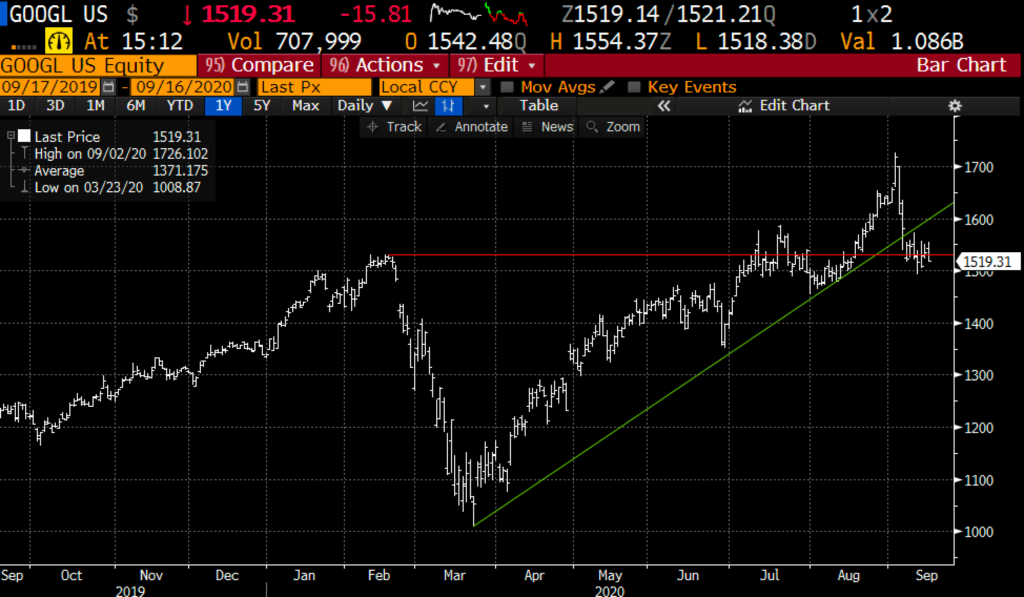
GOOGL’s 13.5% YTD gains are far more muted than its mega-cap peer group, also below its uptrend, and now below its breakout level from Aug, not pretty when you add in the relative underperformance:
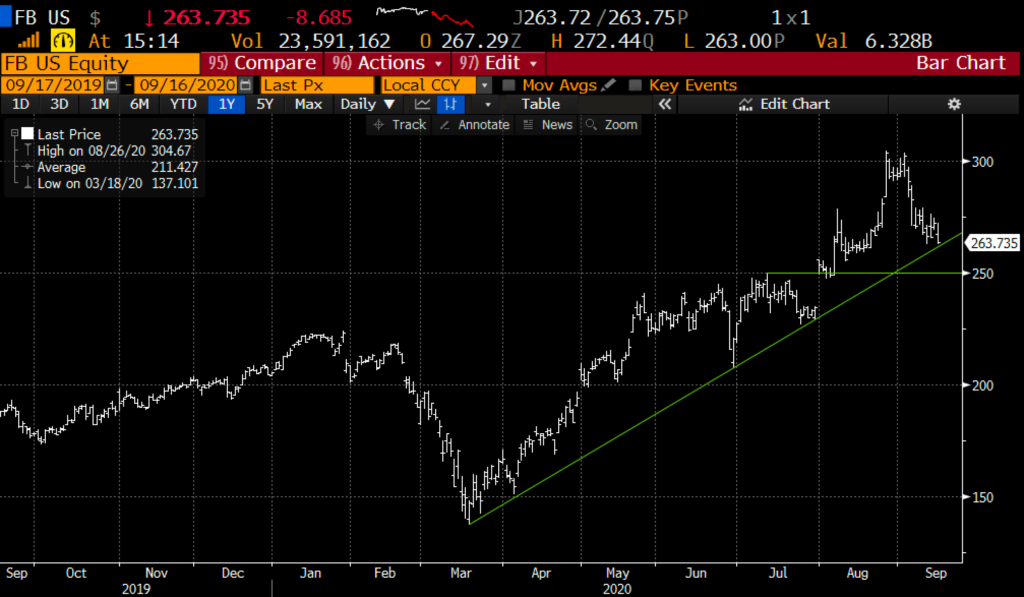
FB, despite the headlines about regulatory action looming, is still above its uptrend from the March lows, with near term support below the trend at its August breakout level near $250:
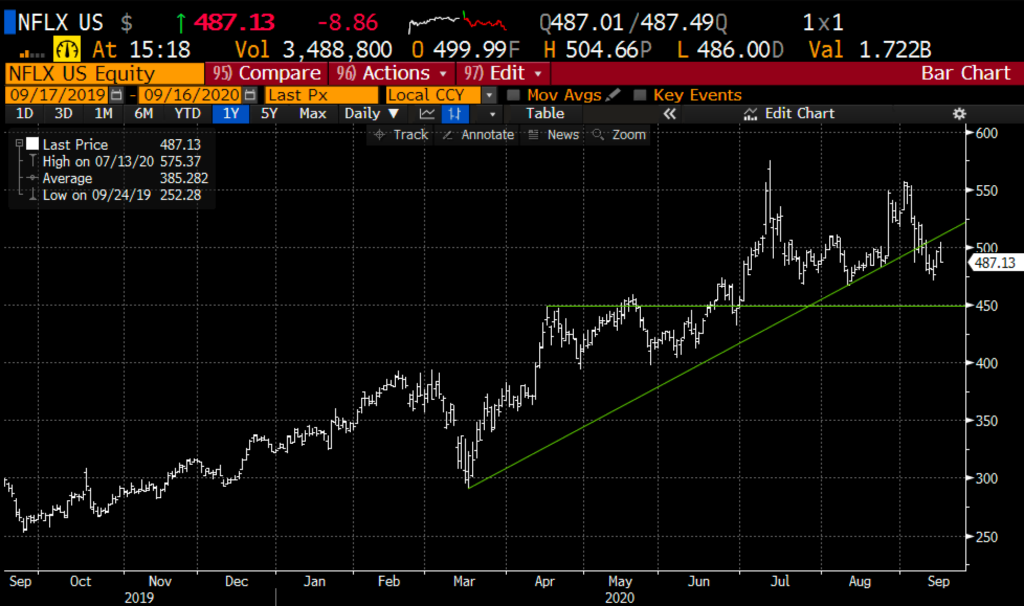
NFLX is a fairly unique from these others as the stock did not confirm the new high in the broad market earlier in the month, with its July high looking like a massive blow-off top, and now below its uptrend with near-term support near $450:
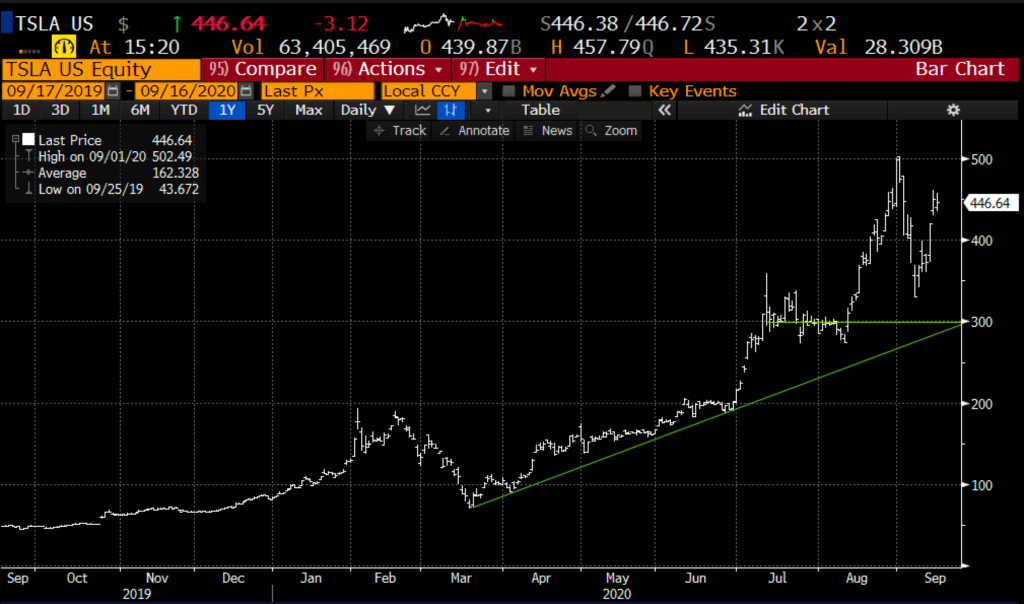
Lastly, TSLA which defies gravity, up 433% on the year, sporting a $416 billion market cap, down only 10% from its recent all-time highs, with no real support until the intersection of its uptrend from its March lows and the launching pad from its early August lows:
Continued weakness in these names makes the QQQ the most vulnerable index etf in my opinion. With the QQQ near $276, the Oct 276 put costs about $10, or about 3.5% of the etf price, which seems fair given its ytd gains, its gains off of its March lows, and the concentration of performance in the top 6 or 7 names detailed above.