On June 1st prior to Zoom’s (ZM) Q1 results that evening, when the stock was $203, I had the following hedge idea in the weekly options for long holders of the stock who were fearful of a sharp decline, after the stock’s massive year to date gains far exceeding that of the broad markets:
As I said in the tweet, the options market is implying about a $30 move in either direction by Friday’s close. To figure that out I take the at the money straddle (the call premium + the put premium) in the weekly expiration and divide by the stock price.
There is something fairly interesting going on in ZM options, there is skew towards the calls rather than the puts, meaning that the calls are more in demand, and back to my friend looking to hedge a portion of his long position that gives him a slight edge if he is looking to buy puts or put spreads, but definitely if he is looking to finance puts by selling a call, a trade structure none as a collar.
FOR INSTANCE, VS 100 SHARES OF ZM LONG AT $203, YOU COULD BUY THE JUNE 5TH WEEKLY 230 – 180 COLLAR FOR A 40 CENTS CREDIT
Before we move onto today’s fiscal Q2 earnings lets first review this hedge idea from June… the idea was to take the implied weekly move and use those bounds on both sides of the stock to sell a call to finance the proceeds of buying a put. The implied move range would have worked ok not hurting profits above $230, and the put protection proving not to be necessary.
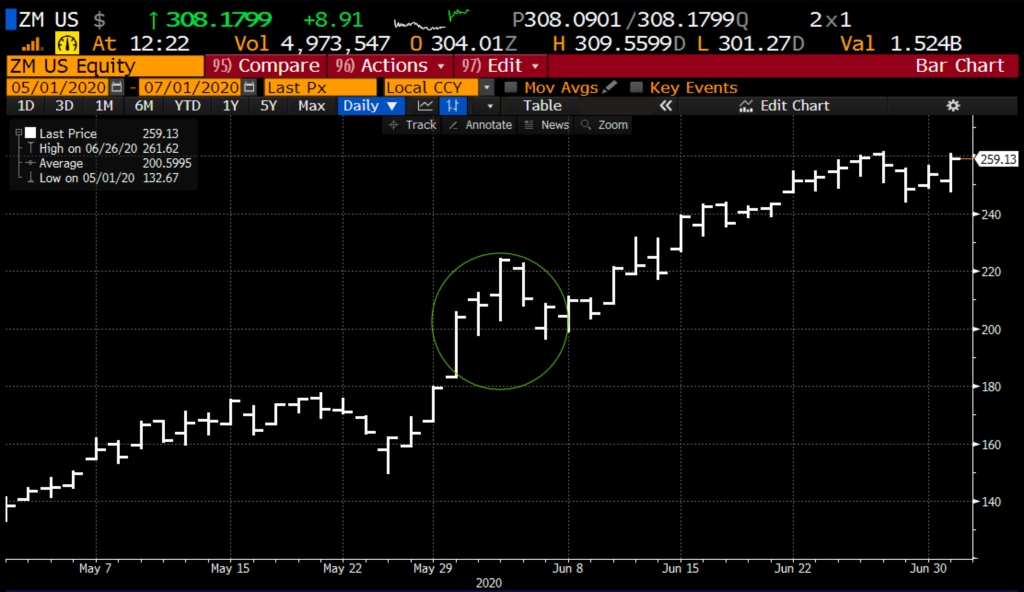
Hedge structures should be used in stock’s like ZM tactically around potentially volatile events, but the stock’s performance this year demonstrates that routinely selling calls whether to add yield vs a long stock position or in the case of a collar to define risk would have offset some dramatic upside performance.
Today after the close ZM report their Fiscal Q2 Results. The options market is implying about a $36 weekly move, most of which is for tomorrow’s earnings reaction, or about 11.5% in either direction. Since going public last year the stock has moved about 10% in either direction the day following its first 5 earnings reports.
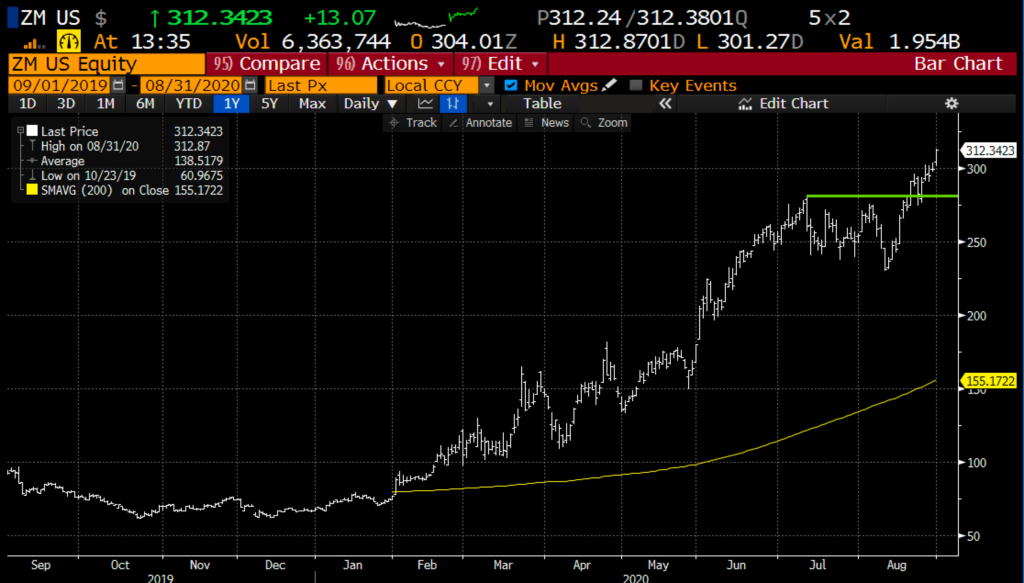
Shares of ZM are trading at a new all-time high as I write, up 4.4% on the day, up 358% on the year and up 765% from its April 2019 IPO sporting an $88 billion market cap. Just to put that in perspective that is half of Cisco’s (CSCO) market cap, a company has a competitor to ZM’s only product, which will book $50 billion in revenues in the current fiscal year vs ZM’s expected $2.2 billion. While it is only a 1 product company, the stock is so highly valued they have gone from an acquisition target of large diversified tech or communications company to an acquirer.
As for the chart, there is NO overhead resistance with support near its recent breakout to nee highs near $280. The stock is 100% above its 200 moving average, which is not something you should be able to say about a company of this size in a normal market environment.
So what’s the hedge? If I were inclined to put a short-term hedge on against a long stock position I might consider the following collar in Sept 4th weekly expiration:
vs 100 shares long at $312.50, you could Buy the – Sept 4th weekly 280 – 350 collar for even money
-Sell to open 1 Sept 4th weekly 350 call at $5.35
-Buy to open 1 Sept 4th weekly 280 put for $5.35
Break-even on Sept 4th close:
Profits of the stock up to $350. At or above 350, 100 shares of stock would be called-away per 1 contract short. If the stock is at or above $350 on Friday you could always cover the short 350 call to keep the long position intact.
Losses of the stock down to 280, important near-term support, but protected below.
Rationale: collars make sense for long holders who are more worried above extreme near-term volatility to the downside over extreme upside, usually into an event like earnings.