This morning shortly after the open I recorded my weekly In The Money segment with Fidelity Investments where I discussed this week’s new all-time highs in the S&P 500, what Treasury Yields are saying about the pace of our economic recovery. I would also add that the day after the S&P 500 (SPX) got back above its prior all-time high from February, Apple’s (AAPL) market capitalization passed two trillion dollars, the first company ever to do that. What’s interesting about that to me is that the SPX has sorely lagged the Nasdaq’s 25% year to date gains, up only 5%, but yesterday on the day that the SPX made that new high, only 6% of its components also did so:
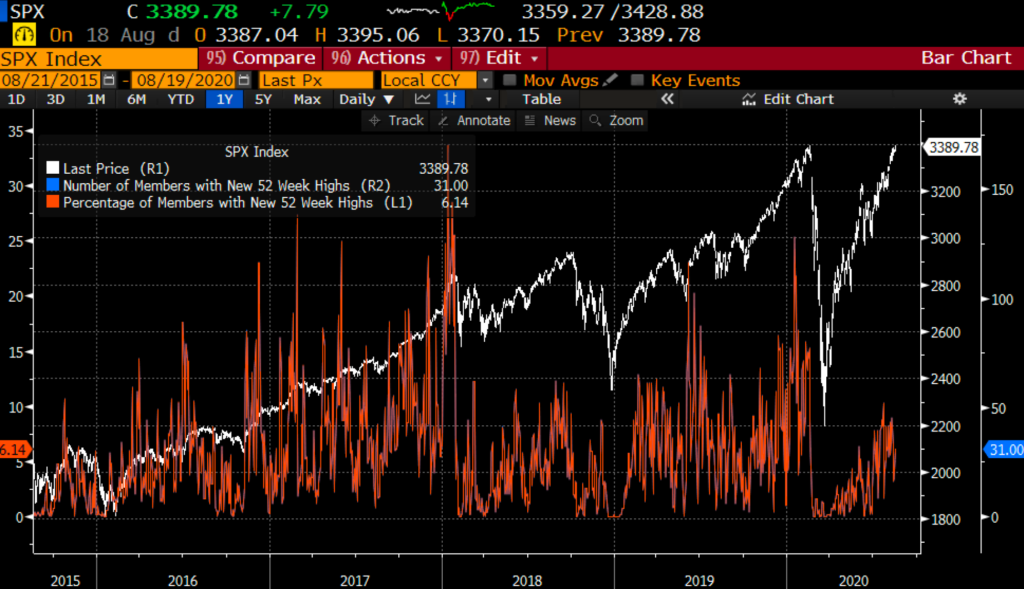
In January when the SPX was making new highs daily the components new high percentage was near 25%, and back in early 2018 and all of 2017 the new highs percentage was usually between 15 and 25%. IN a nutshell, AAPL up 59% on the year, MSFT up 33% on the year, AMZN up 77% on the year, GOOGL up 16% on the year, and FB up 28% has added close to $2 trillion in market cap from the March lows or the total market value of the Russell 2000 Index.
Here is today’s video, see my notes below:
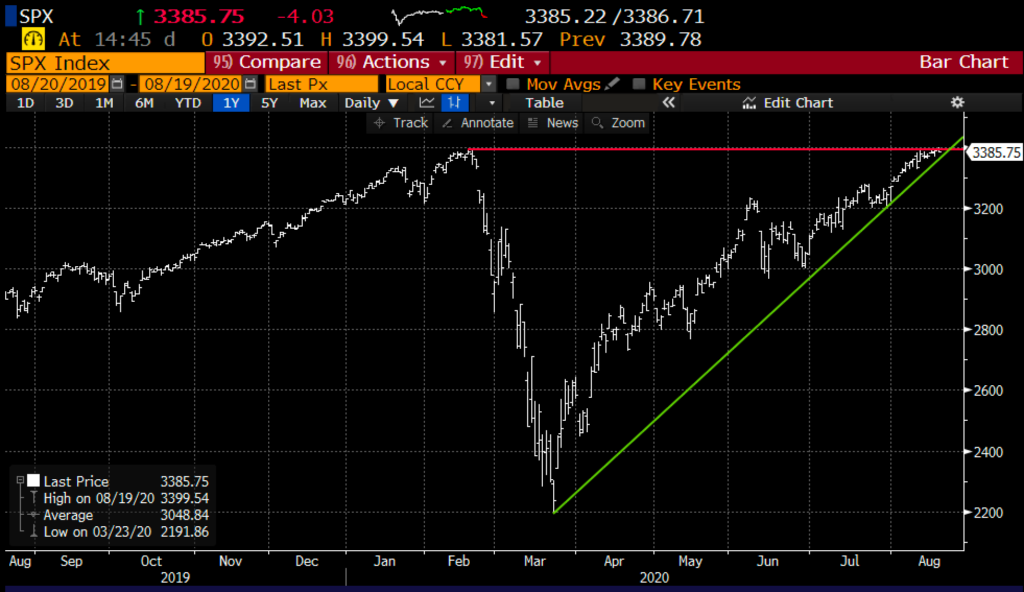
The SPX is at a crucial technical spot. Breakout or Breakdown?
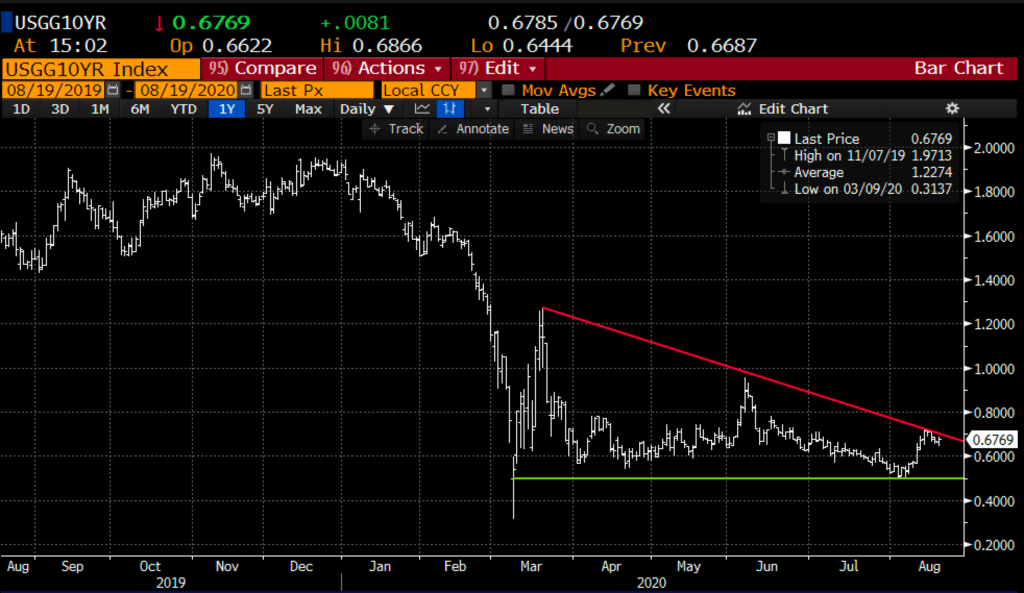
Since making a matched closing low from March 9th earlier this month, the yield on the 10-year U.S. Treasury has doubled, causing some suggest this is a bullish sign on the pace of the recovery in the U.S. It is at important technical resistance and a failure here could mark a retest of support. It is my view that yields headed to or below zero will be bad for equties.
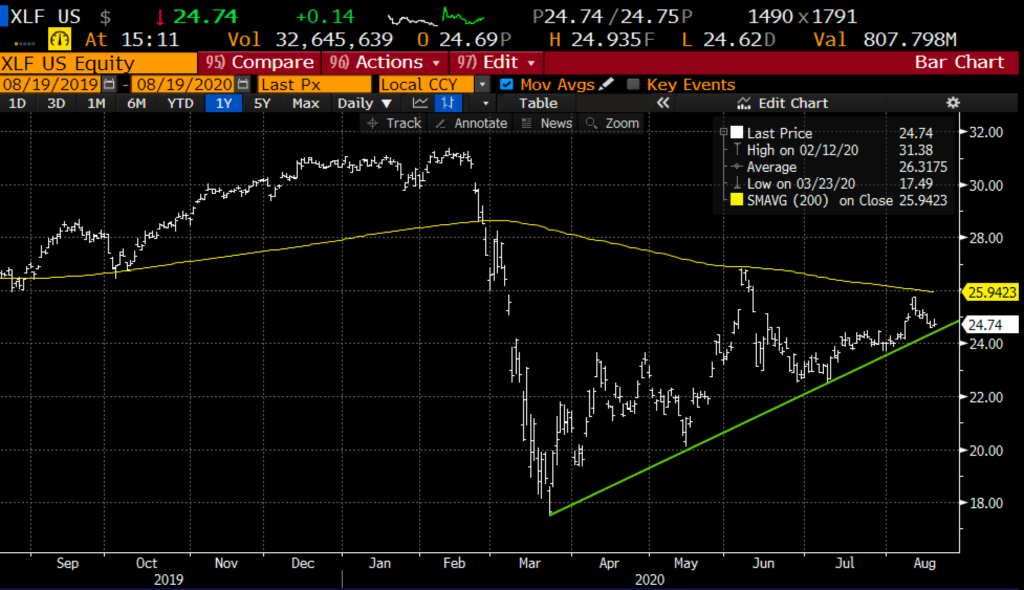
Trade Idea #1: XLF
Which leads me to my first trade idea in the XLF, the S&P FInancial Select etf that tracks U.S. bank stocks. It is my view that the relative underperformance in this group is more reflective of the weakness on Main Street as opposed to the euphoria on Wall Street. Low rates forever, flat yield curve, and large loan loss reserves have caused investors of all stripes (including Warren Buffett) to hit the pause button on the group. If there is a real vaccine sooner than later, more fiscal stimulus and optimism about a quicker than expected recovery in 2021, then banks stocks will be the next IT group in my opinion and likely outperform the which as performed so well during the pandemic. But in the next couple months I suspect banks break key technical support at their uptrend from the March lows:
So what’s the trade?
Bearish Trade Idea: XLF ($24.95) Buy Oct 25 – 20 put spread for $1
So What’s the trade?
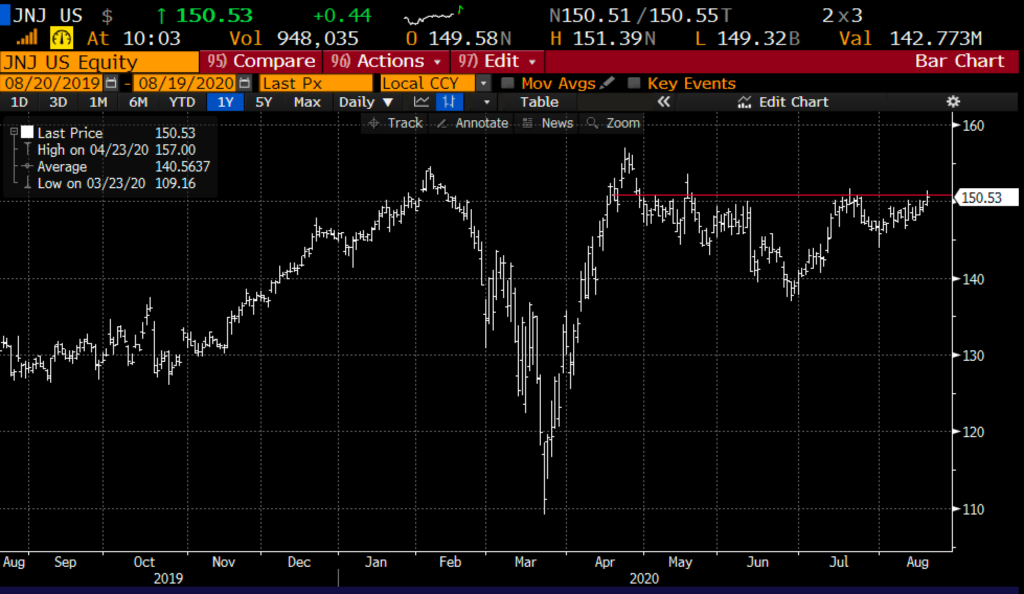
One could buy the stock here with a target above $155, but I’d consider a downside stop loss near technical support $145…or to express this view with defined risk consider buying an at the money all in Oct:
Bullish Trade Idea: JNJ ($150.50) Buy Oct 150 call for $5
-Profits above 155
-Losses of up to 5 between 150 and 155
Rationale: this trade idea risks 3% of the stock price and has a break-even of the same level while also setting a stop-loss near technical support equal to the premium paid.
__________________________________________________________________________
Prior Trade Idea Management:
With two trading days to August expiration, let’s take a look at some trade ideas from prior shows that are near or in the money and need to be managed prior to Friday’s close:
On July 29th, I detailed a bearish trade idea in the XLE, the energy Select etf:
Trade Idea: XLE $37 Buy Aug 37 put for $1.45
Update: with the XLE at $37.10 this put is now worth about 30 cents, at this point you need to keep a close eye on it, if the stock were to close at $36.99 on Friday’s close you’d be exercised and short 100 shares per one put contract long.
On June 24th I detailed a bearish trade idea in shares of Exxon (XOM):
Trade Idea: XOM ($46) BUY AUG 45 – 35 PUT SPREAD FOR $2.50
Update: With XOM at $42 this trade is worth ~$3, at this point it is really a market call, I’d stop this trade at the premium paid, and keep a close eye into Friday’s close, or take the profit now.
On June 10th I detailed a bullish trade idea in WMT when the stock was $121.50 playing for a new high over the summer:
Bullish Trade Idea WMT ($121.50) Buy Aug 125 – 135 call spread for 2.50
Update: with the stock at $132.50 as I write the trade is worth above $7.50, it can only be worth $10 at expiration, at this point it is a market call over the next two trading days… I think it makes sense to take the profit and move on.
On June 3rd I detailed a bullish trade idea on the TLT, iShares 20-year U.S. Treasury bond etf:
TLT ($159.50) BUY AUG 160 – 175 CALL SPREAD FOR $3.50
Update: With the TLT at $163.80, down from its August high near $172, it makes sense to close this trade out prior to expiration and use the initial premium as your stop.