Microsoft (MSFT) will report its fiscal Q4 results today after the close. The options market is implying about a 4.5% one day move tomorrow. The weekly at the money July 24th 210 straddle (the call premium + the put premium) is offered at about $10, or about 4.75% of the stock price, if you bought the implied move you would need a rally above $210 or a decline below $200 by Friday’s close to make money. Shares of MSFT have only moved about 1.25% on average the day following their last four earnings reports.
The stock is up nearly 33% on the year and up nearly 60% from its March lows, sporting the second highest market cap in the U.S. at $1.58 trillion behind Apple’s (AAPL) $1.68 trillion and just above Amazon’s (AMZN) $1.53 trillion. It is truly astounding that these three companies make up nearly $5 trillion in market cap.
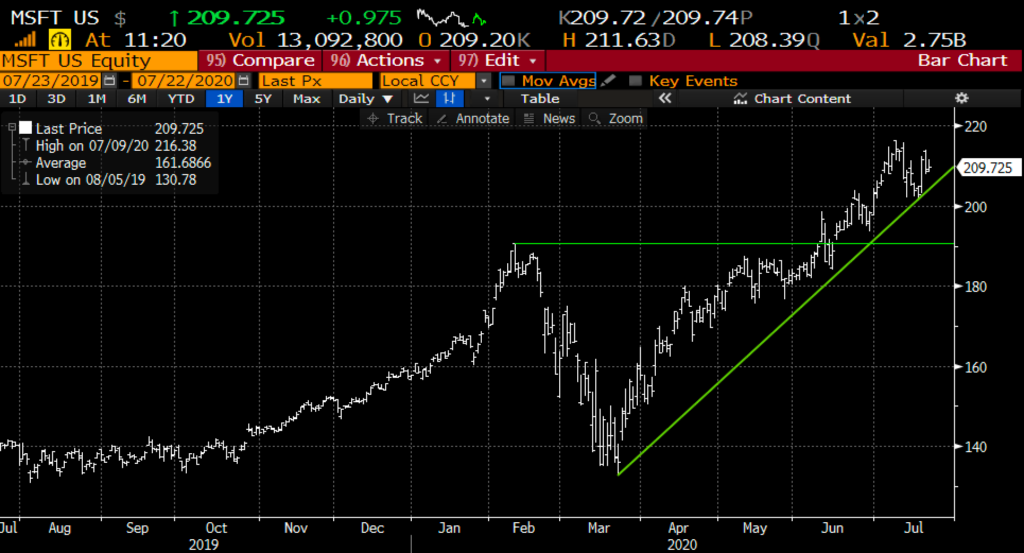
The only really overhead technical resistance the stock has is it last week’s all-time high just above $216 with support near Monday’s low at the uptrend from the March lows and then down near $190 the stock’s mid-June breakout to new highs:
To suggest that Wall Street analysts are giddy about the stock is an understatement with 32 buy ratings, only 4 holds and no sell ratings with an average 12-month price target of about $220.
My friend Jared Weisfeld, who some of you might have seen on Fast Money, tech specialist at Jeffries had the following comments into the print in a note to clients this morning:
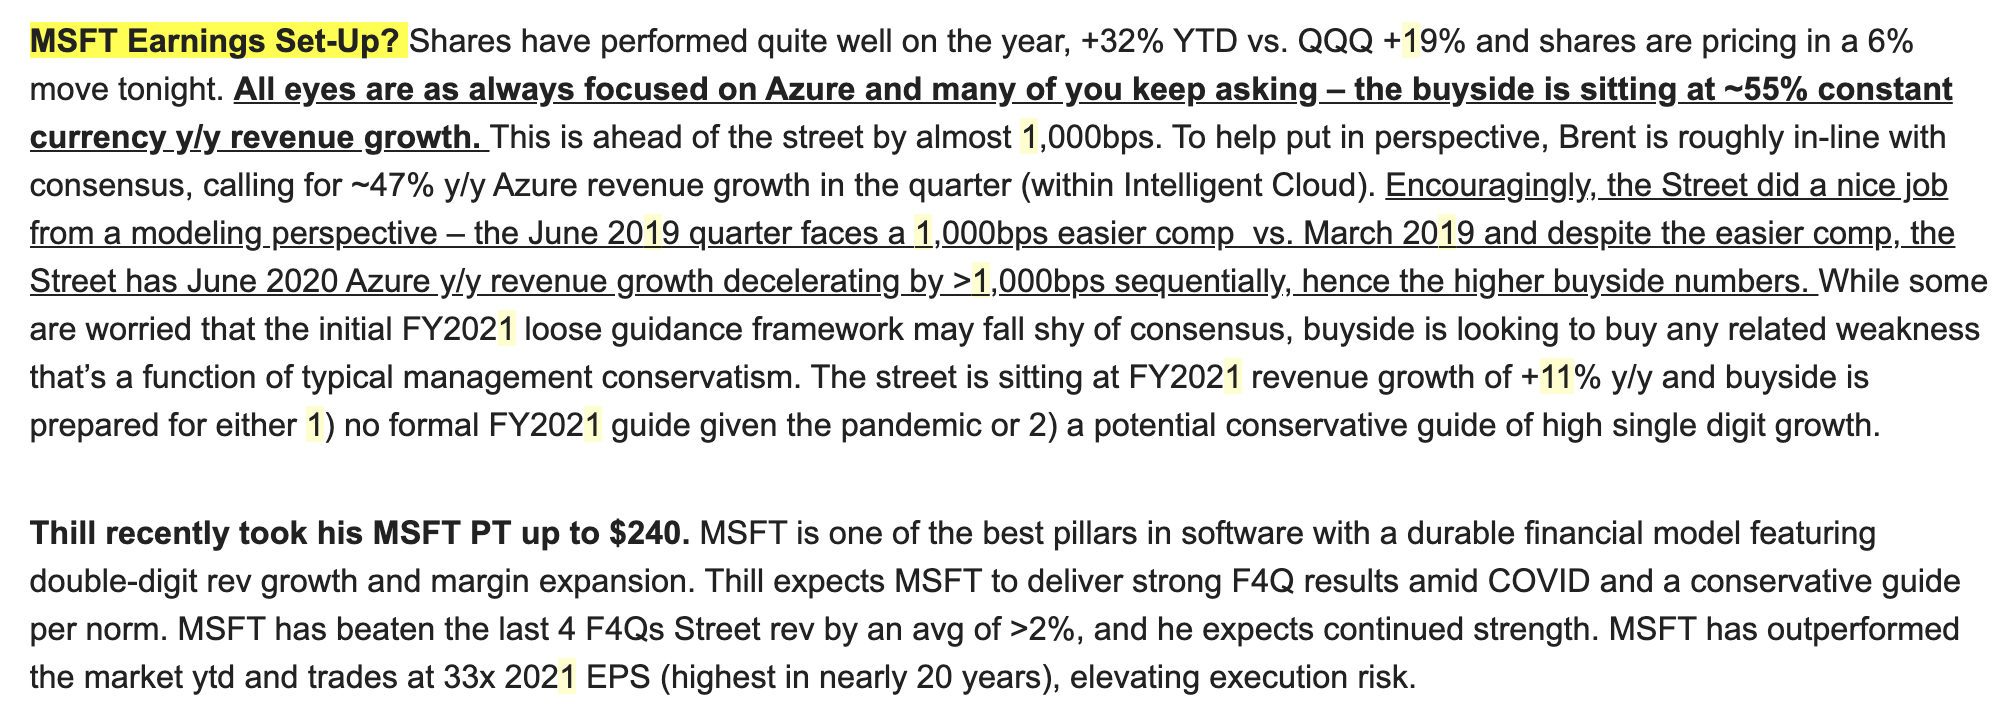
My comment is that if they hit the whisper numbers investors might start pricing in a sort of “as good as it gets” scenario and start pricing in a pull forward in-demand and deceleration for the back half of the year.
So what’s the trade? Options prices are expensive for those looking to express long premium directional views. For example, if you wanted to play for a breakdown of the. uptrend and a pullback to the $190 breakout level, the Aug 210 – 190 put spread (vs $210.30) costs about $6.60, but only offers a max potential payout of $13.40, or 2x the premium at risk. That is not a great risk-reward in my opinion.
On the flip side if you wanted to play for a breakout to new highs, possibly a run-away breakout if the company were to post a big beat and raise, the Aug 210 call (vs $210.30) costs $8.70, or about 4% of the stock price. To be fair the Aug 210 put also costs $8.70 but I like the idea of defining the risk to the downside vs the upside because who knows how high these stocks can go
But for long holders of the stock, worried about a potential sharp decline this week pst results you could consider collars, selling one out of the money call vs 100 shares long and using the premium received to buy one out of the money put, creating a scenario where you participate on the upside to the short call strike, have losses down to the long put strike but are protected below. One would do this if there are more concerned with extreme post-earnings downward volatility than upward volatility above what-ever short strike you use. I think it makes sense to target the weekly implied move, in this case $10.
For example:
vs 100 Shares of MSFT long at $210.50 Buy July 24th weekly 220 – 200 collar for even money
-Sell to open 1 July 24th weekly 220 call at $1.70
-Buy to open 1 July 24th weekly 212.50 put for $1.70
Break-even on July 24th expiration (Friday):
Profits of the stock up to 220, called away there, but can always cover the short call to keep long stock position intact.
Losses of the stock down to 202.50, but protected below
It is worth noting that this set-up offers skew to the calls, which is not that normal, so you get potentially $9.50 of upside and $8 of downside.
Also, this morning on my Fidelity In The Money segment (will post this afternoon when completed editing etc) I detailed a hedge in the QQQ that some of you might be interested in Oct expiration, and it is wide, much wider than one that I have detailed recently. Here are my notes:
QQQ ($265.50) Buy Oct 260 – 200 put spread paying $10
-Buy to open 1 Oct 260 put for ~$12
-Sell to open 1 Oct 200 put at ~$2
Break-even on Oct exportation:
Profits of up to 50 between 250 and 200 with max gain of 50 at 200 or lower
Losses of up to 10 between 250 and 260 with max loss of 10 above 260
Rationale: this trade risks less than 4% of the etf price, breaks-even down 5.5% and has a max potential gain 19% if the QQQ is down 24% on Oct expiration, or basically back to flat on the year…