Friday Bloomberg posted the following story:
S&P 500 Sends Bullish Technical Signal With Golden Cross
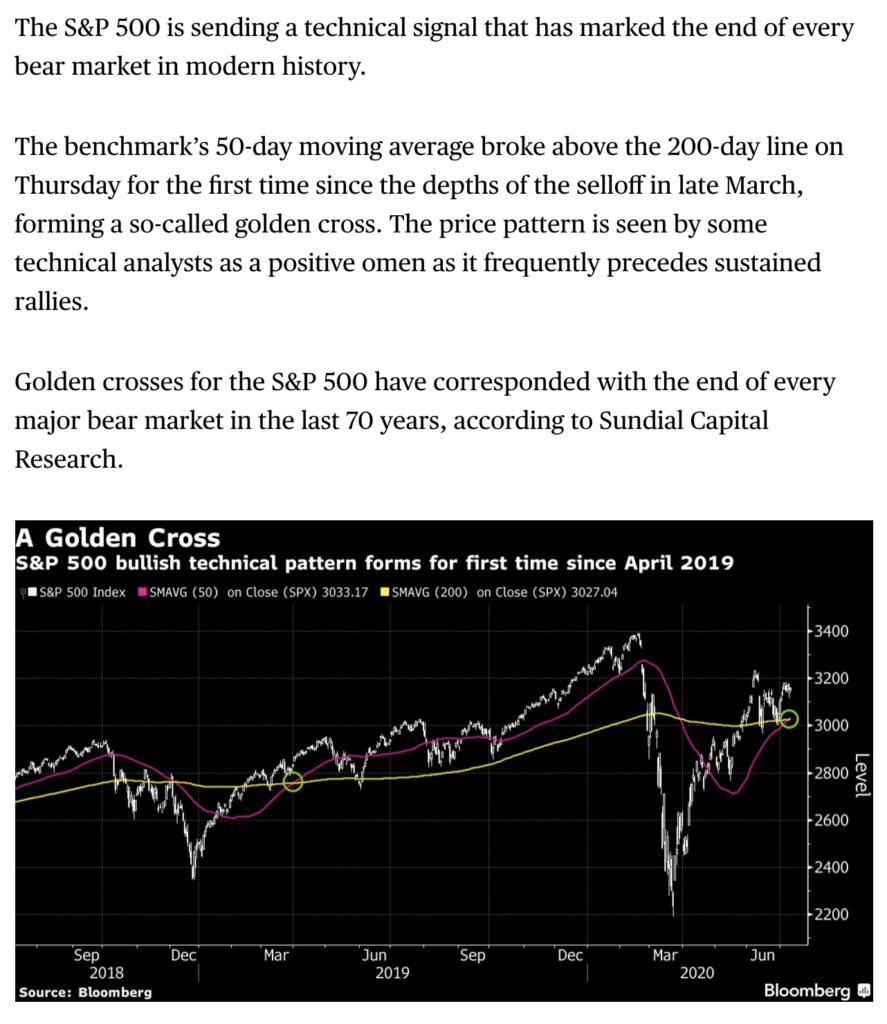
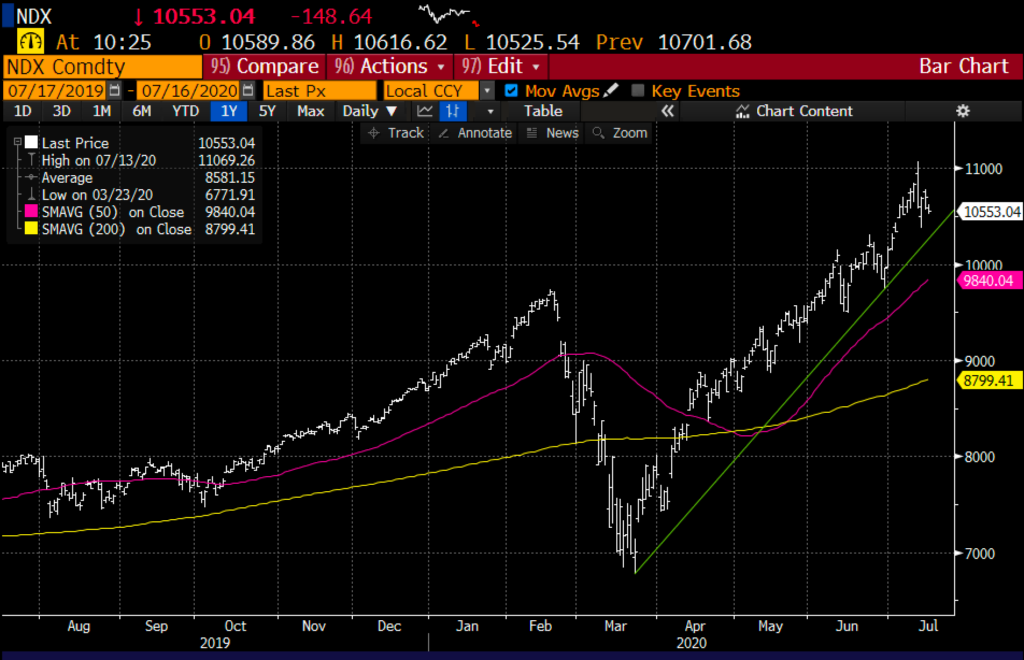
Divorced from the reality of the current economic and health situation in our country, this technical set-up and sentiment assume that there are few headwinds in the back half of this year. It is worth noting that on yesterday’s close, the S&P 500 (SPX) closed near flat on the year, a little less than 5% from its all-time highs. While the SPX has come a long way from the March lows, it has massively underperformed the Nasdaq Composite ytd, which until its reversal on Monday had been making new all-time highs what seems like on a daily basis for a month. To highlight the Nasdaq 100’s (NDX) outperformance, look at the spread between its 50-day and 200-day moving average, some 11% above the 200day, while the 200day is 20% below the current price:
Monday’s intra-day reversal in the NDX may prove to be a very significant milestone for the stage of the market recovery, 6% intra-day reversals from all-time highs are not that common:
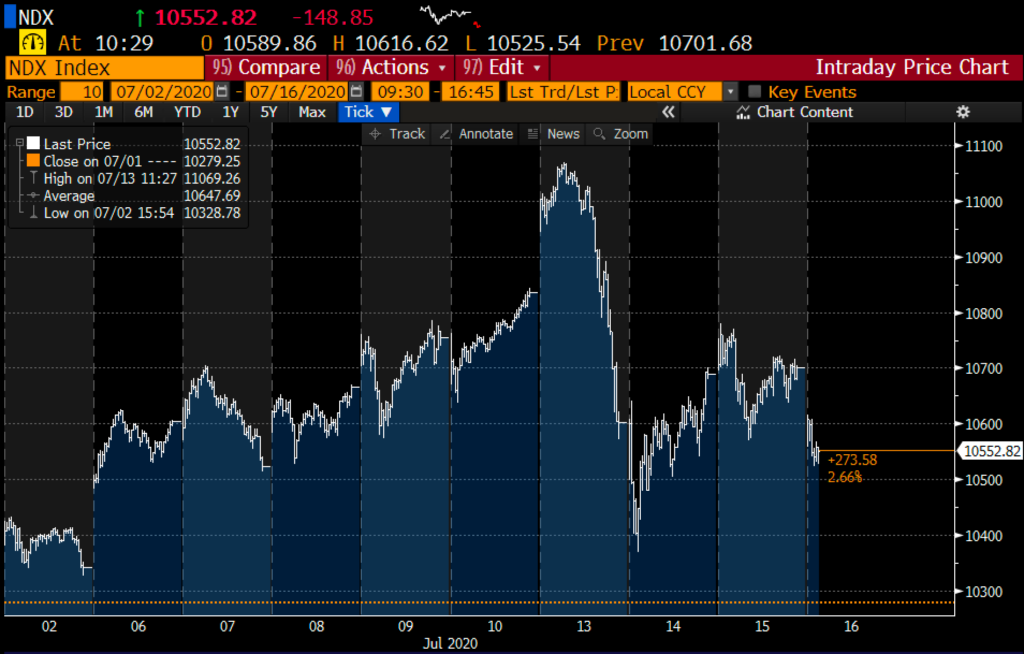
The frequency in which this has happened? the @sentimenttrader answered this question Monday on Twitter:
The Nasdaq 100 rallied more than 2% intraday to set an all-time high, then reversed to close down by more than 1%.
It’s done that twice. Today was one.
March 7, 2000 was the other. pic.twitter.com/zEJoOrf6JZ
— SentimenTrader (@sentimentrader) July 13, 2020
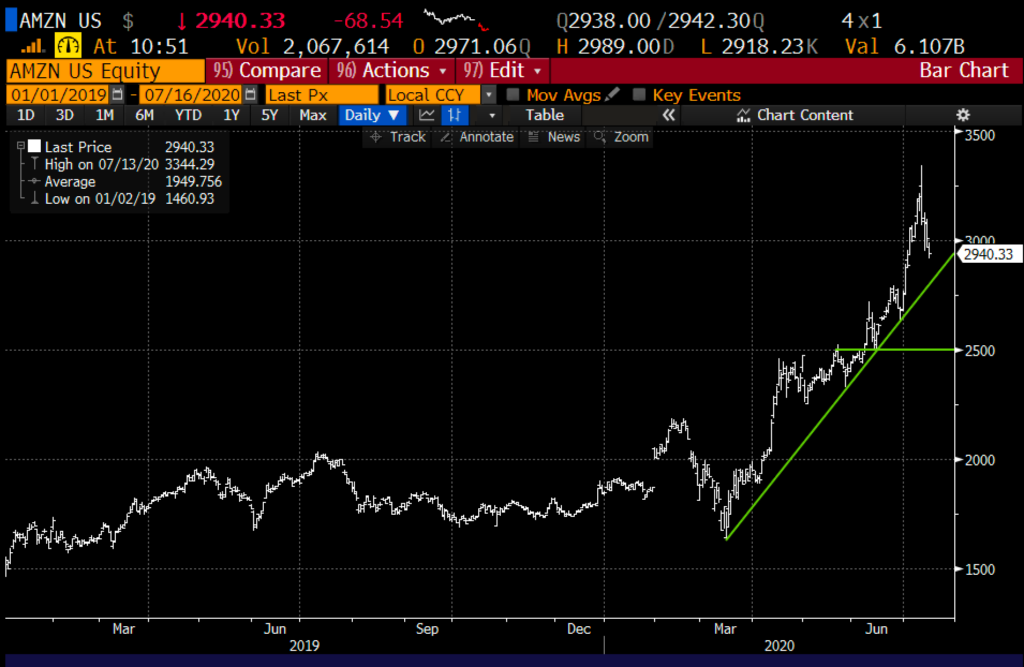
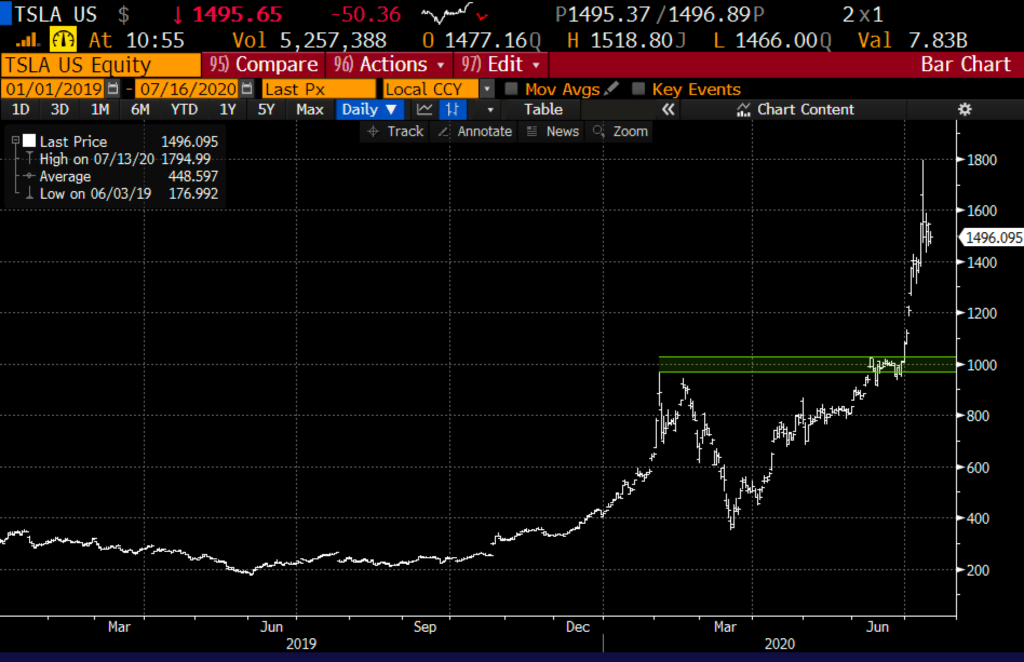
There are really only two stocks in the Nasdaq that really matter from where I sit, AMZN, and TSLA, both are very different but very similar in many ways. Without going into a full-on bull-bear debate on each and compatibly lets just say that they both exude irrational investor exuberance and have way overshot even the most staunch bulls near-term expectations.
AMZN is quickly approaching the uptrend from the March lows which represents key n-t technical support, below that you have the 2500 breakout level from early June:
and TSLA which was up more than 70% this month alone is now consolidating after Monday’s sharp reversal with no real support until $1030:
So what’s the trade?
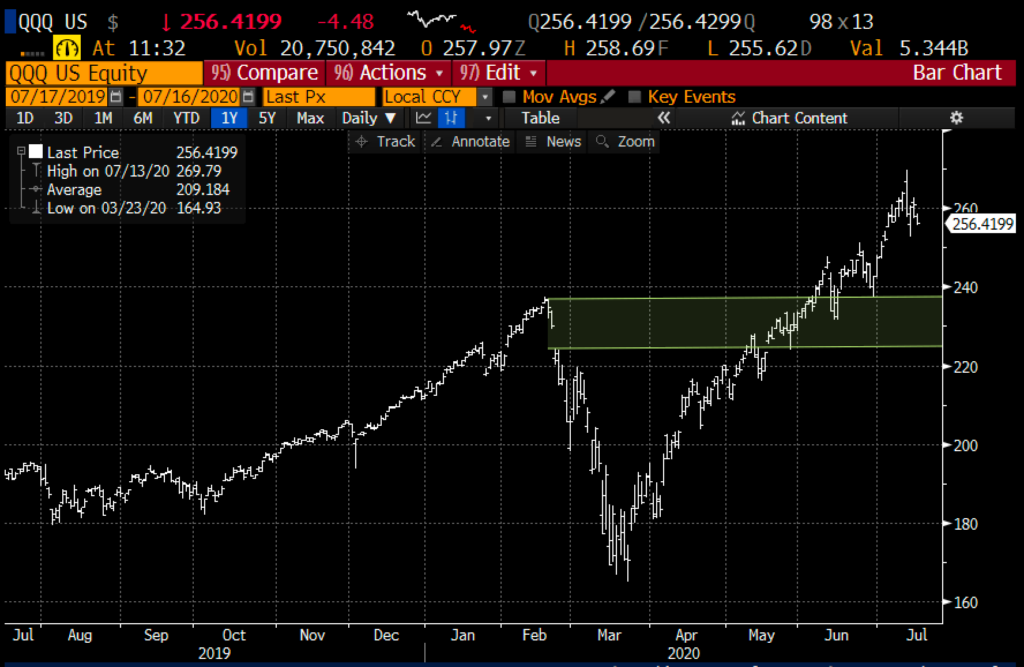
The fever has broken, and NFLX’s response to what are now high expectations to tonight’s earnings will be an important tell for the Nasdaq 100. My near-term downside target for the QQQ is the early June breakout level near $240 but if things were really to start to snowball the low end of the support range back to the Feb gap near $220 seems possible:
If I were inclined to play for a short term move back towards $240 as a directional trade idea I might consider the following put spread in Aug expiration:
Bearish Trade Idea QQQ ($257) Buy Aug 250 – 235 Put Spread for $3.50
-Buy to open 1 Aug 250 put for $7.50
-Sell to open 1 Aug 235 put at $4
Break-even on Aug expiration:
Profits of up to 11.50 between 246.50 and 235 with max gain of 11.50 below 235
Losses of up to 3.50 between 246.50 and 250 with max loss of 3.50 above 250
Rationale: this trade idea risks a little less than 1.5% of the etf price, with a break-even down 4%, and a max gain of up to 4.5% if the etf is down 8.3% in a month.
OR for those looking for a hedge against stocks they own in the Nasdaq 100, specifically, the leadership, consider a wider put spread in September 30th quarterly expiration:
Bearish Trade Idea QQQ ($257) Buy Sept 30th Quarterly 250 – 220 Put Spread for $7
-Buy to open 1 Sept 30th quarterly 250 put for $12
-Sell to open 1 Sept 30th quarterly 220 put at $5
Break-even on Sept 30th quarterly expiration:
Profits of up to 23 between 243 and 220 with max gain of 23 below 220
Losses of up to 7 between 243 and 250 with max loss of 7 above 250
Rationale: this trade idea risks a little less than 3% of the etf price, with a break-even down 5%, and a max gain of up to 9% if the etf is down 14% in two and 1/2 months.