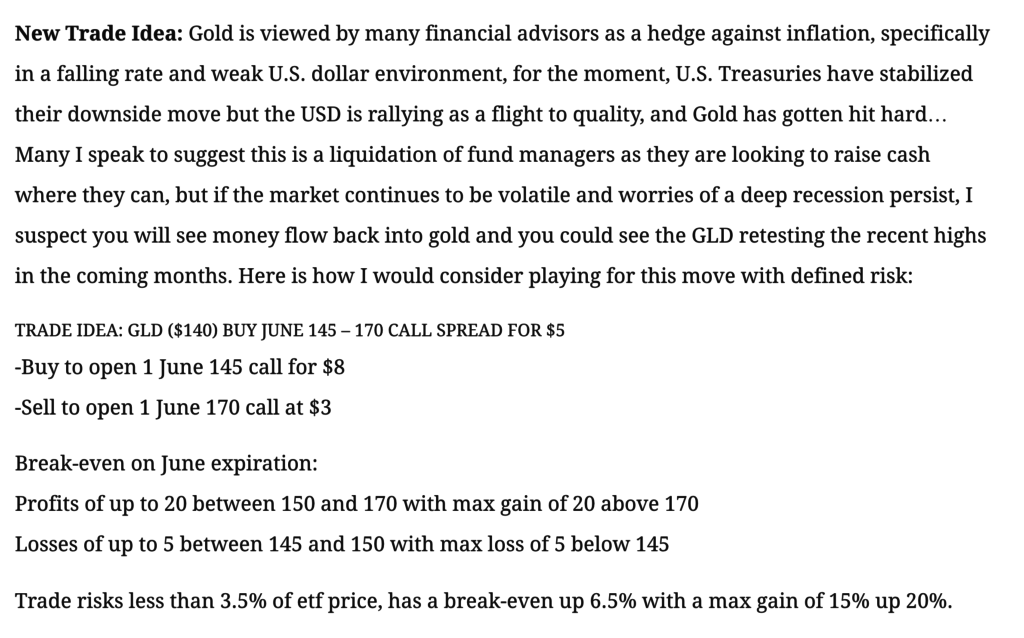
In the throes of the sell-off in March, I detailed a bullish case for the GLD, the etf that tracks gold on March 18th and on In The Money with Fidelity (read and watch here) when it was trading $140:
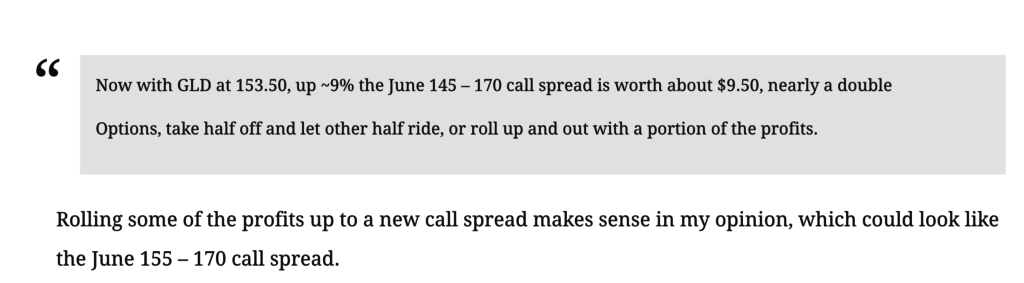
A week later when GLD was trading $153.50 I had the following update (read and watch here):
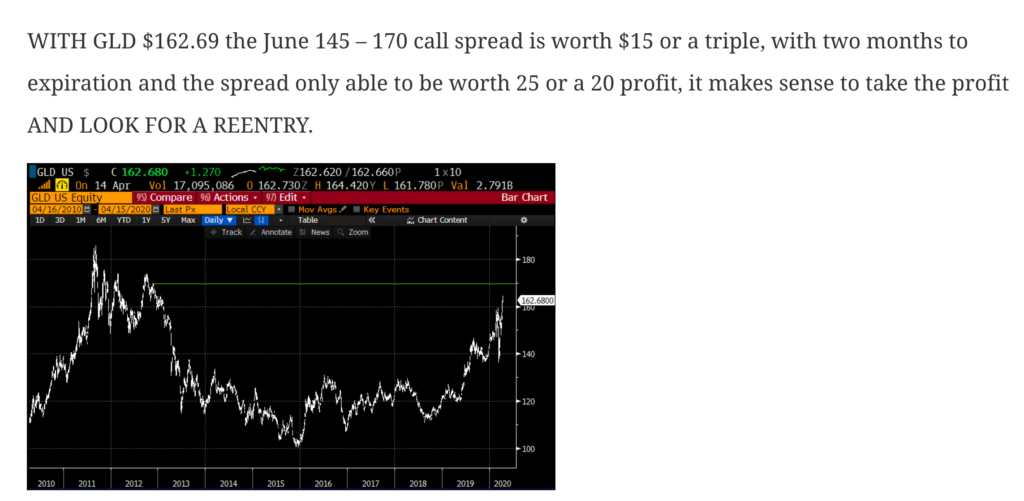
And then again when GLD was $162.69 on April 16th I had the final update (read and watch here)… but the idea was to TAKE PROFITS:
With the stock market down about 4% in two trading days, and the Fed reiterating their plan to keep interest rates low forever and put a floor on bond-buying above what many thought was the case, for the foreseeable future, the Gold bugs are out again in force. As regular readers know I am not one of them, but when the sentiment appears that it might be at an inflection point for the shiny metal it is worth paying attention as the etf is usually quite tradeable, especially with vertical spreads using options.
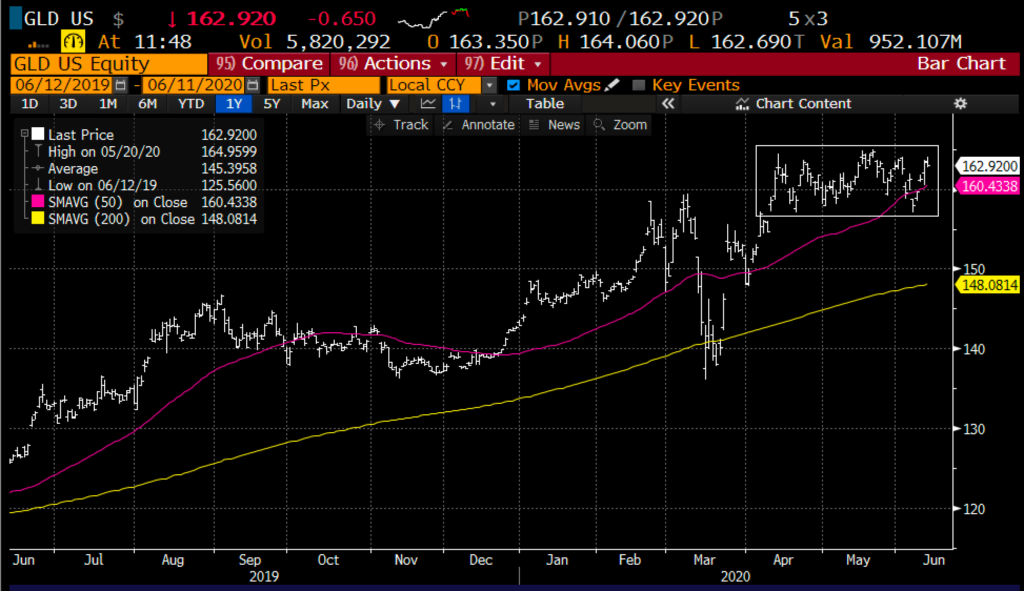
But first, since my initial trade idea in mid-March, the GLD found support at its 200-day moving average and has rallied about 20% from its March lows, but has been consolidating, straddling $160 for nearly two months:
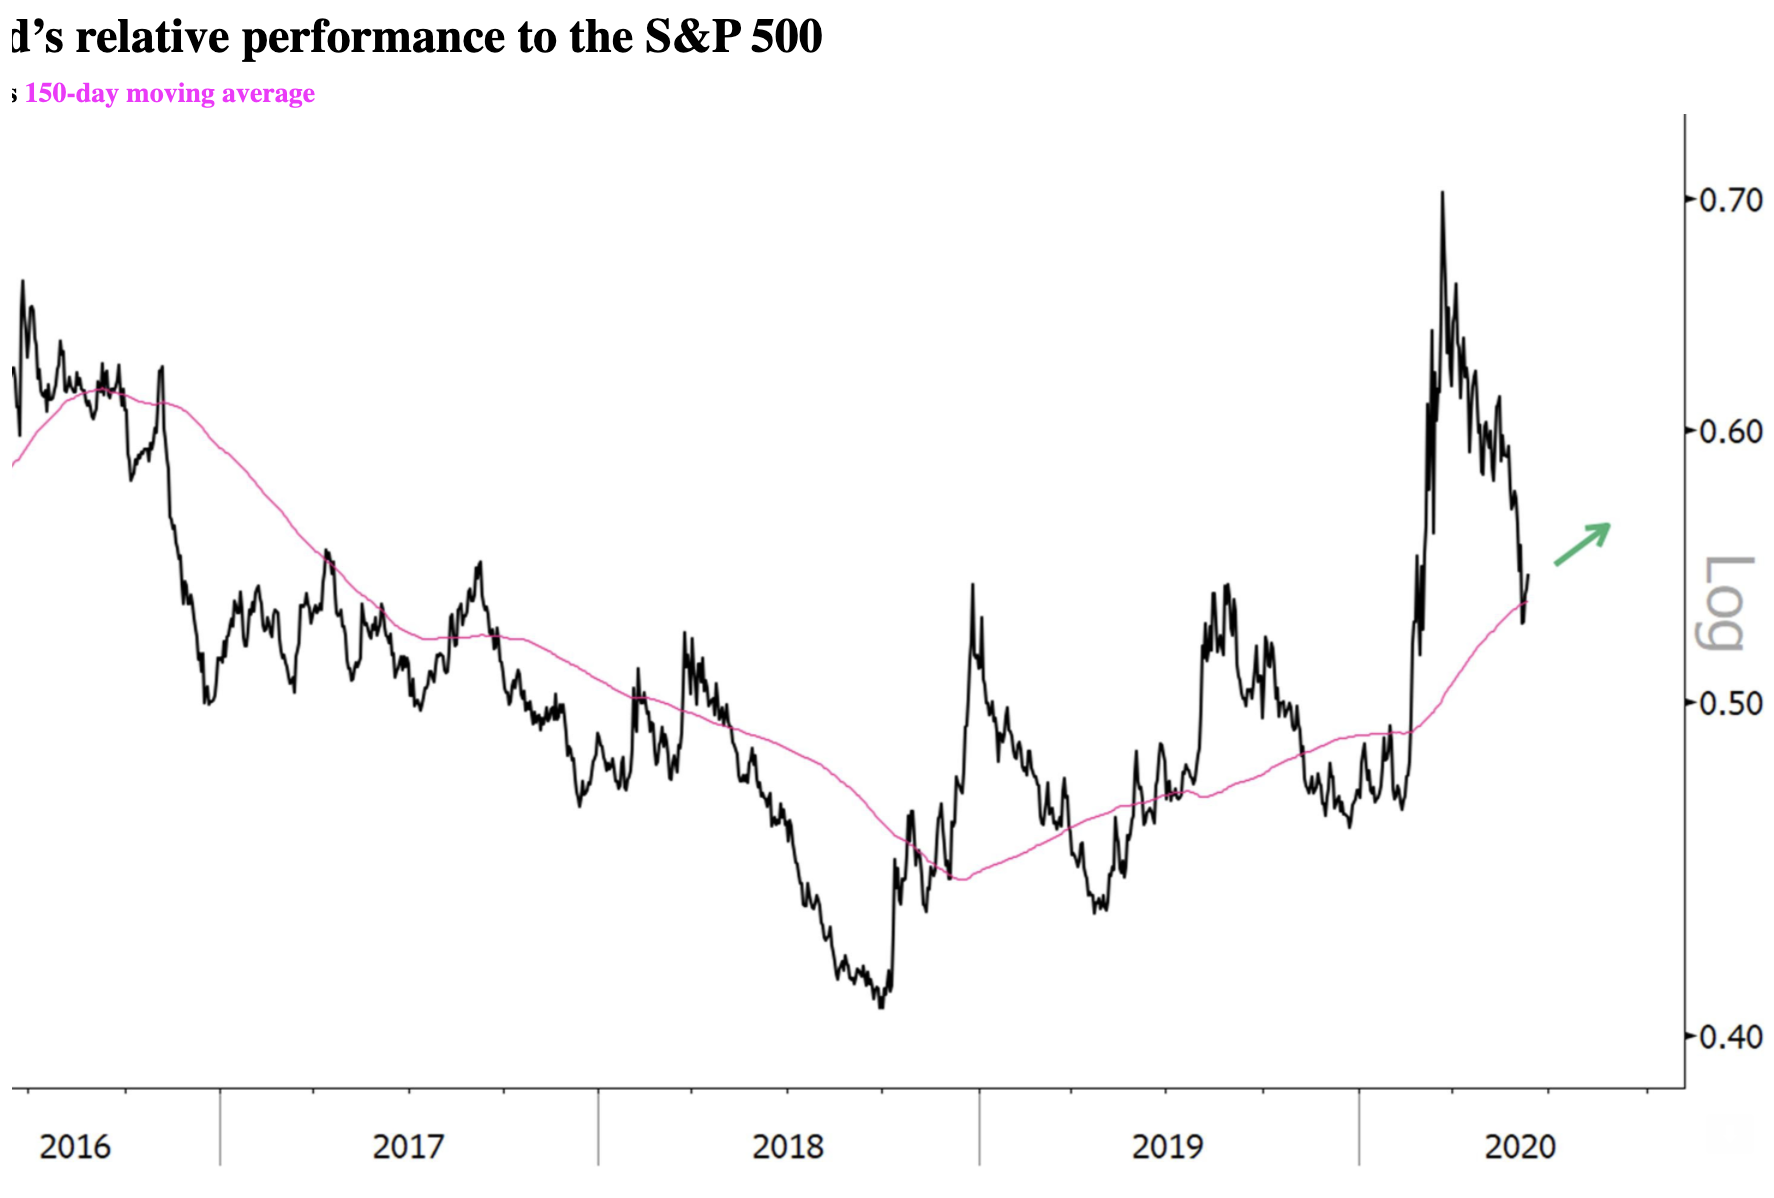
My good friend Carter Braxton Worth of Cornerstone Macro Research sent out this chart today of the ratio of Gold vs the S&P 500 and sees a bounce as it finds support at its 150-day moving average:
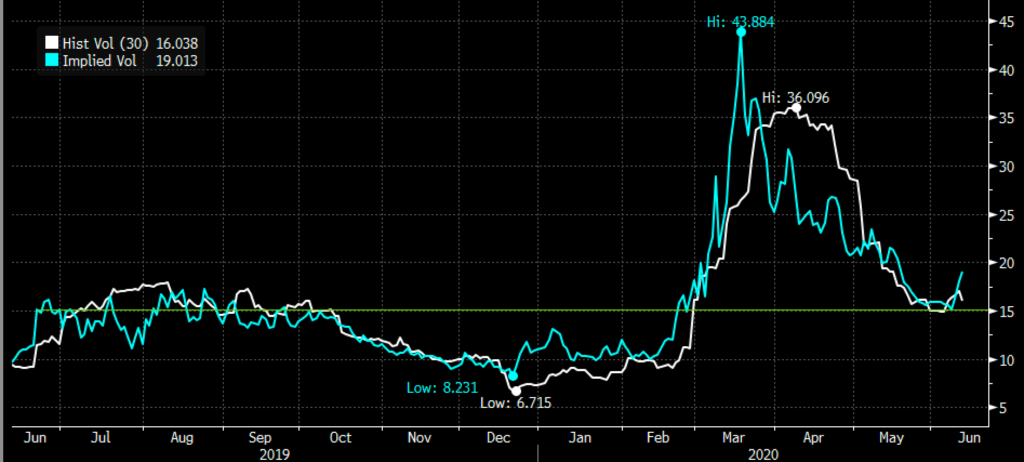
Looking at short-dated options prices in the GLD, they look fairly reasonable, with 30-day at the money implied volatility this week finding support at 15% (blue line below), while 30-day realized volatility (white line below, how much the GLD has been moving) very near its 3-month lows, which could pick up quite easily if the GLD were to break out to new multi-year highs, making options look cheap in the name for those looking to express directional views:
One of the main take-aways for me from the Fed comments yesterday is that while they are deadset on doing whatever it takes to bring unemployment down, they are also very focused on getting inflation up to their targeted range. I suspect that continued narrative through the summer could be the sentiment that causes investors to add some GLD into their portfolios.
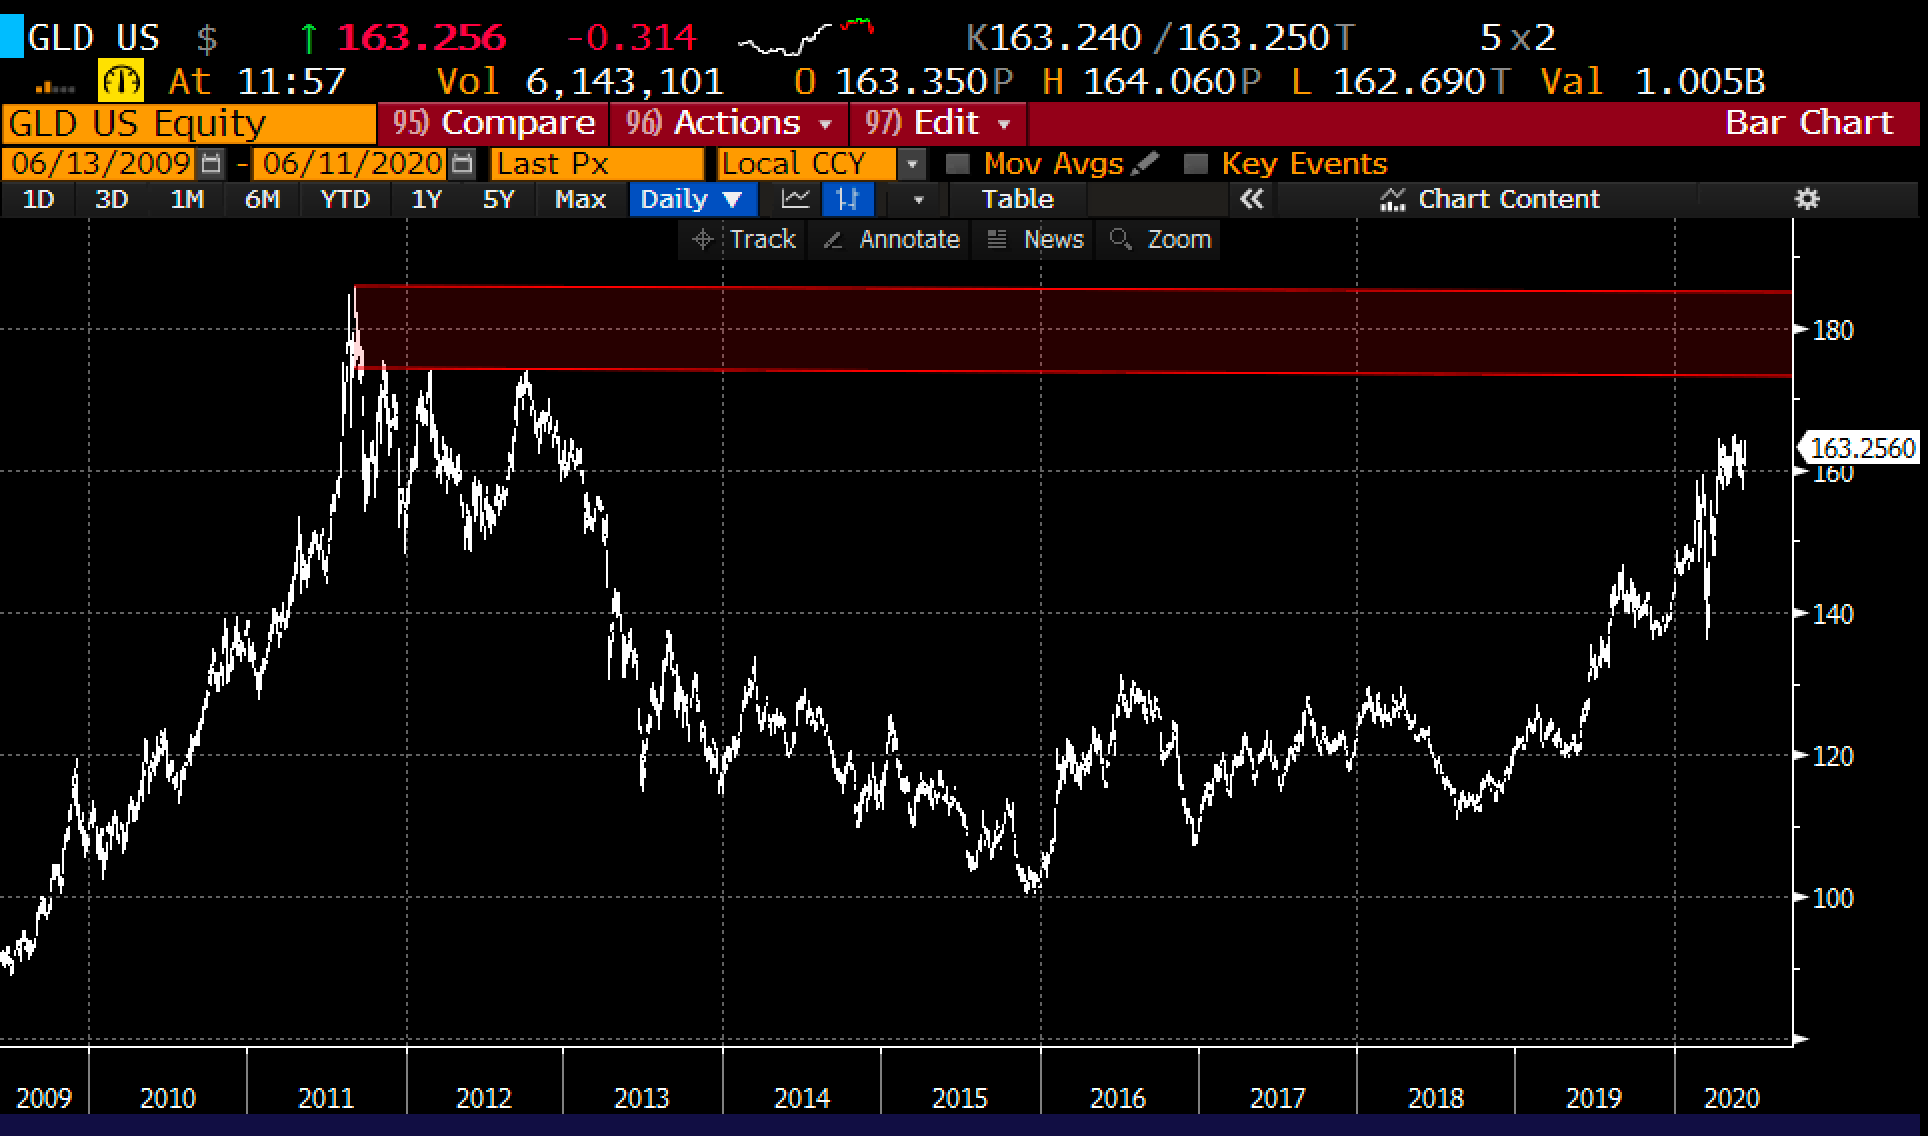
While the 1yr chart of GLD looks like a nice consolidation, the 10-year shows $140 as a significant breakout of a multi-year range with technical resistance back in the range of the 2011-12 highs between $175 & $185, which would be our target for continued gains:
So what’s the trade? Buy calls spreads playing for a breakout of the two-month range and a move to the mid to high $170s:
Bullish Trade Idea: GLD ($163) Buy August 163-180 call spread for ~$4
-Buy to open 1 Aug 163 call for ~5.55
-Sell to open 1 Aug 180 call at ~1.55
Break-even on Aug expiration:
Profits of up to 13 between 167 and 180 with max gain of 13 above 180
Losses of up to 4 between 163 and 167 with max loss of 4 below 163
Rationale” this trade idea risks 2.5% of the price of GLD for a little more than two months, playing for a breakout in GLD that has an 8% payout if the etf is up 10% in two months.