Alphabet (GOOGL) will report its Q1 earnings tonight after the close. The options market is implying about a 5% move in either direction which is essentially in line with the average one day move following the last four quarters and in line with its 10-year average.
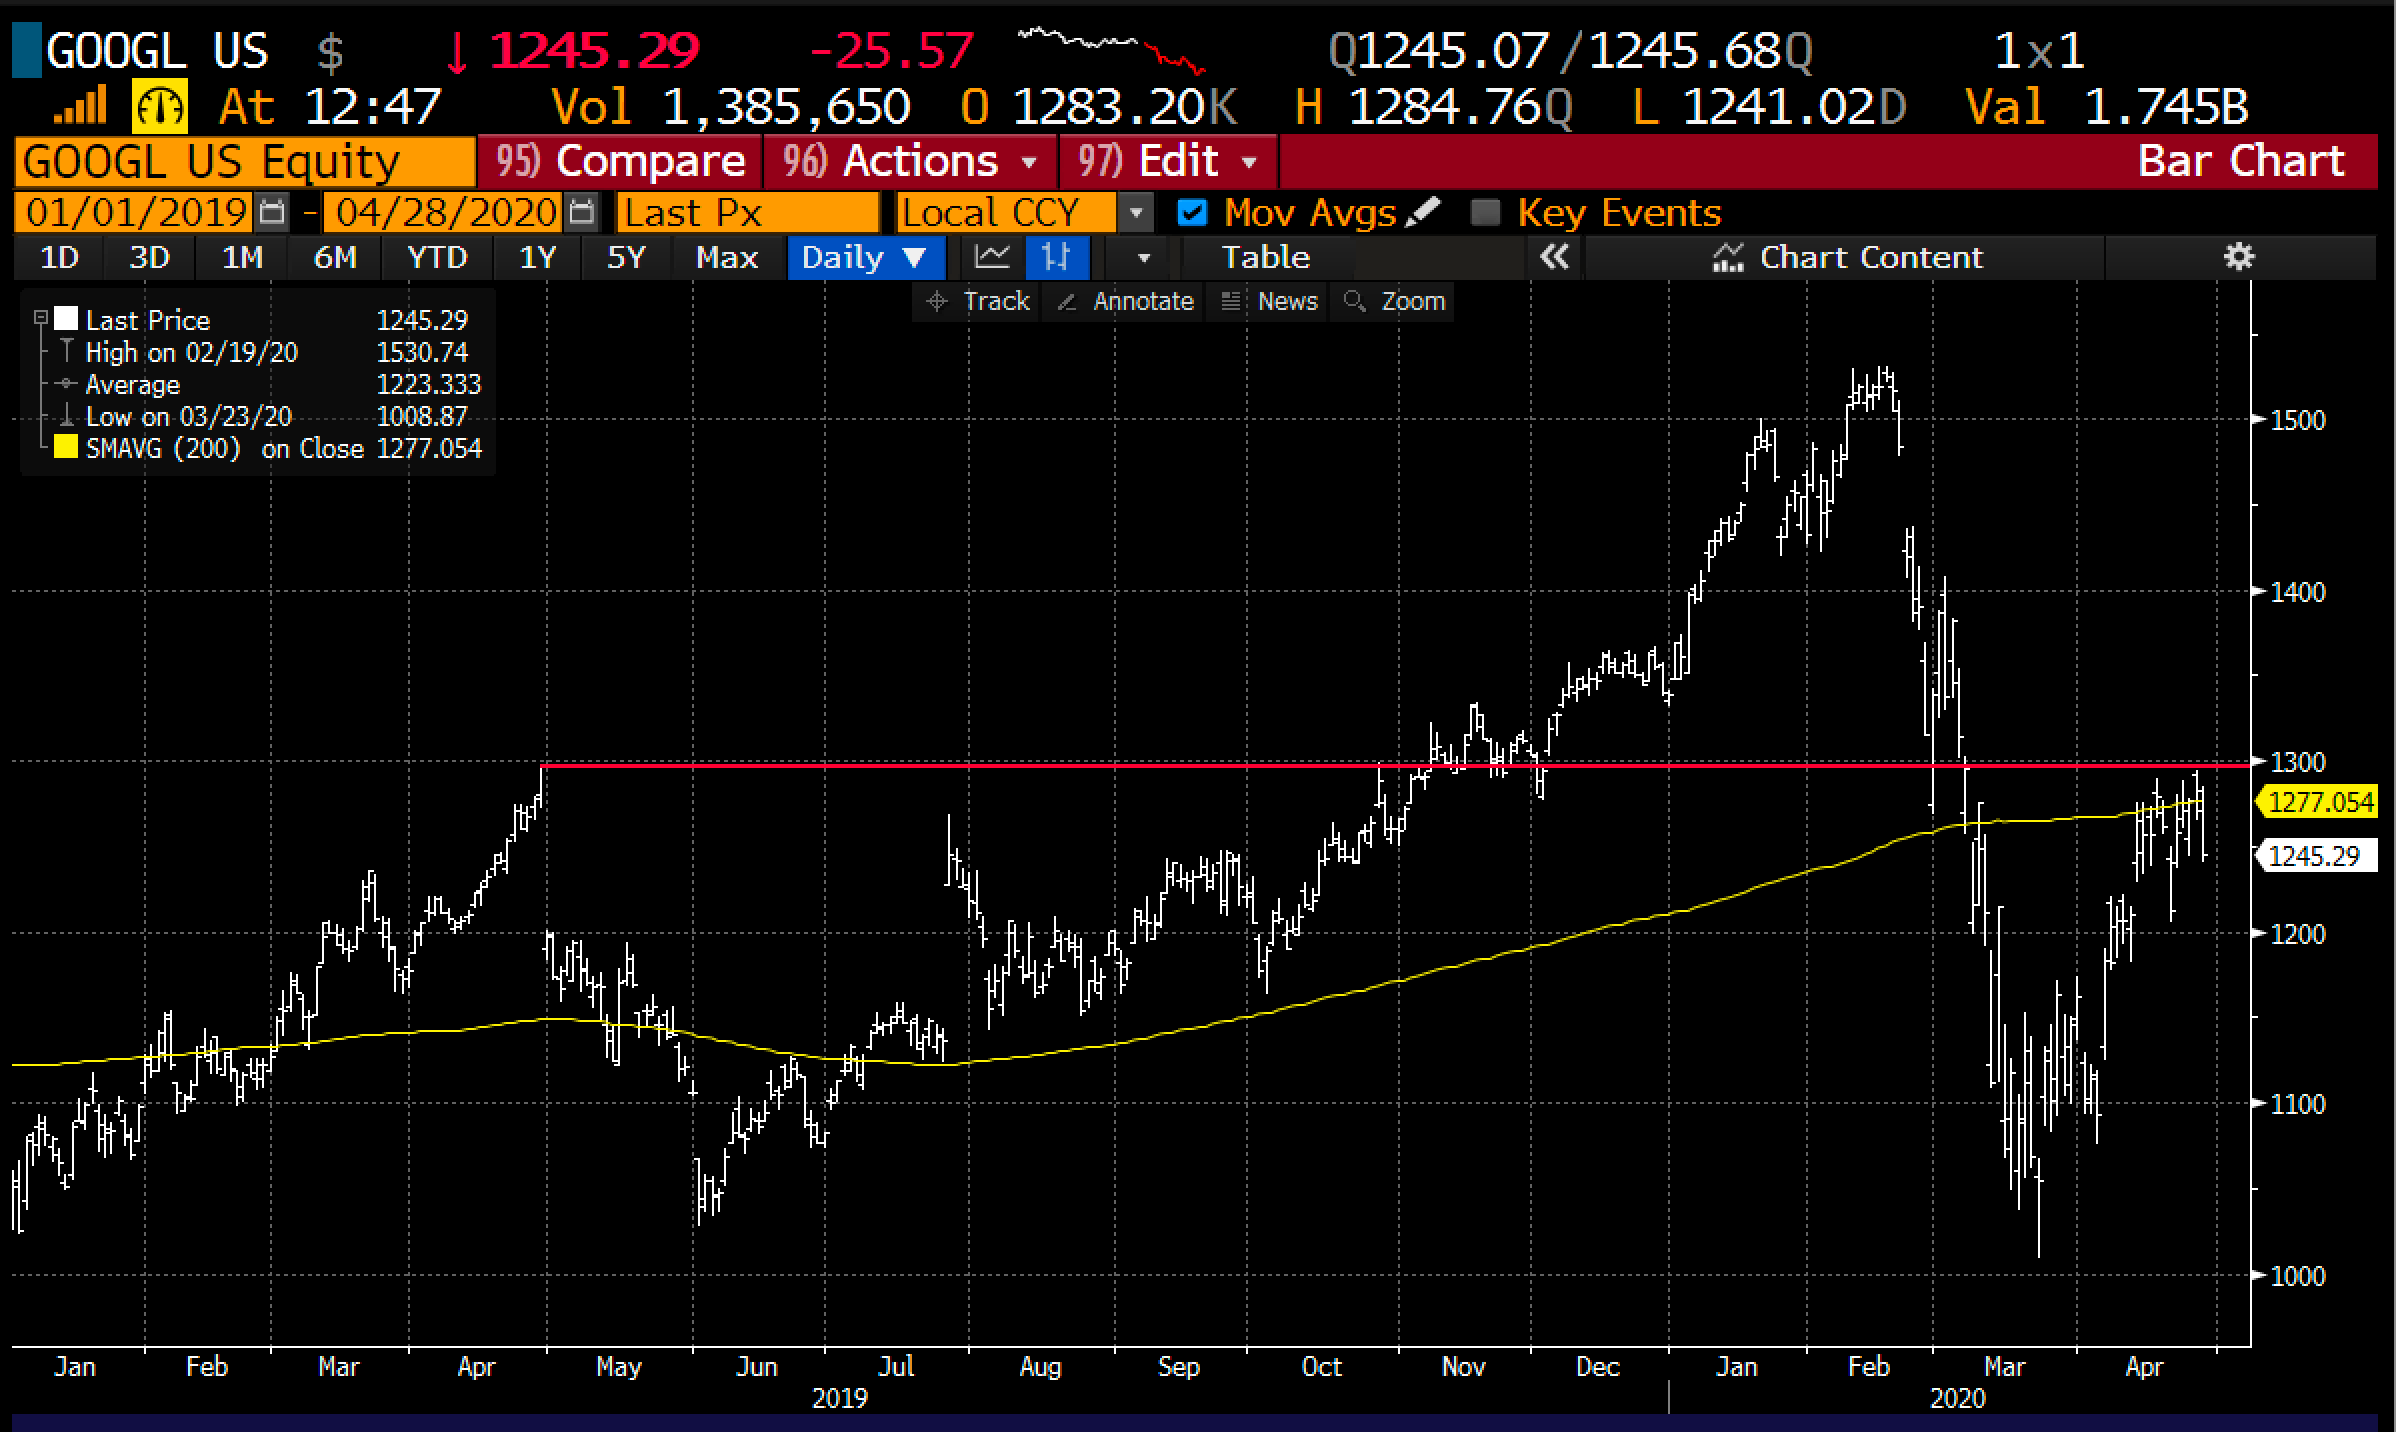
Shares of GOOGL are down 7% on the year, and down about 19% from its all-time highs made in February, The stock for the moment appears to have been rejected at technical resistance at $1300, which is an interesting level as it was where the stock gapped lower from last April after reporting a disappointing Q1 and then broke out from late last year:
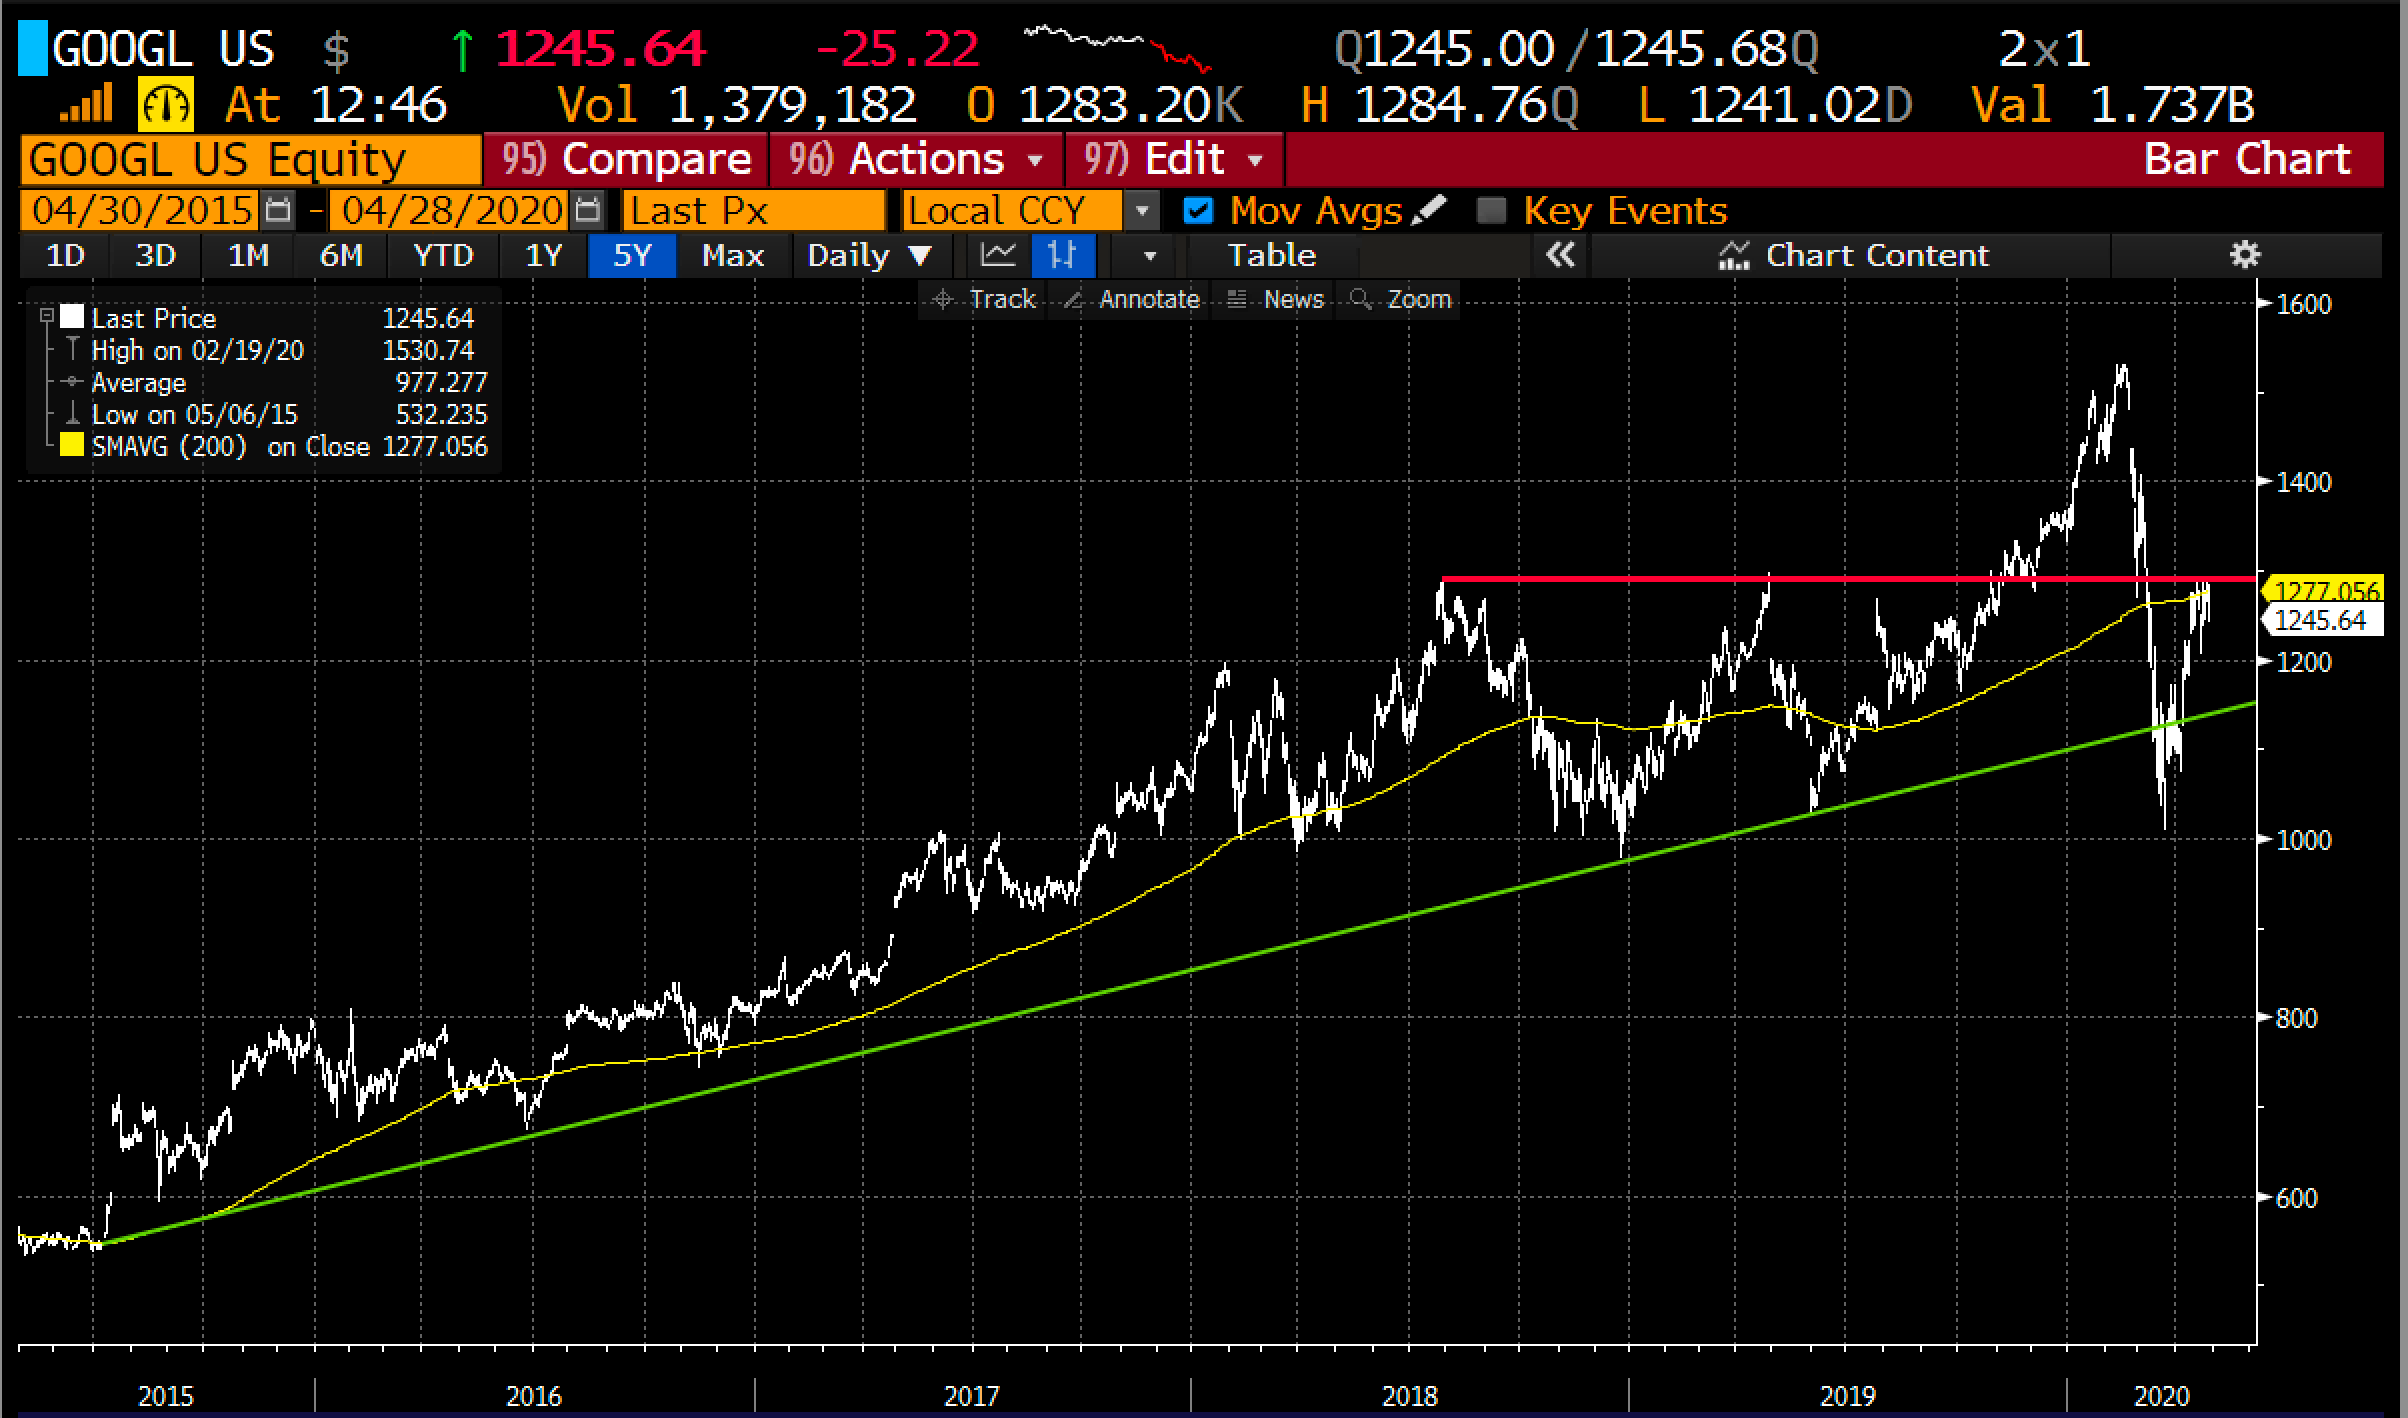
On the downside, obviously the March low just above $1000 will be important support, but prior to that the stock might find some support at the five-year uptrend near $1150:
On a GAAP basis, GOOGL saw its earnings growth decelerated massively in 2019 to just 6% as the company ramped up spending to better protect user’s data. Wall Street consensus right now has EPS declining 14% this year, which is obviously a moving target given the uncertainty surrounding the global economy. Currently, analysts see just 3% revenue growth for the company, and if it were to go negative it would be the first annual decline for sales. The stock currently trades at 31x expected 2020 eps and 23x expected 2021. Investors will look past 2020 multiples and start to place greater emphasis on their confidence in reaccelerating revenue growth and a sharp snapback in EPS growth above 2018’s peak.
RBC Capital’s Mark Mahaney who rates the stock a Buy with a 12-month price target of $1350 highlighted the following key items to look for in the print in a note to clients last week:
Alphabet (“Google”) Will Report Q1 Results on April 28th : For Q1, we expect Gross Revenue of $39.37B, Net Revenue of $32.02B, GAAP Operating Income of $6.56B, and GAAP EPS of $8.54. Our estimates are all well below current Street estimates: $40.99B Gross Revenue, $33.19B Net Revenue, $8.45B Operating Income, & $10.71 GAAP EPS.
Key Items to Focus On: 1) Gross Revenue and Operating Margin Trends for Core Google: We are looking for Core Google Gross Revenue of $39.18B (up 8% Y/Y). Our expectations are that GOOGL was growing Revenue in the high-teens percentages until mid-March when growth rapidly decelerated. We assume Q2 will be the worst impacted quarter with Core Google Gross revenue down 20% Y/Y before making a partial recovery in Q3 (-11%) and Q4 (+5%). We are also looking for $6.56B in Total GAAP Operating Profit (approx. 17% margin, which would imply 150bps Y/Y contraction). We don’t believe SNAP ’s strong Q1 results provide a powerful read-thru given i) GOOGL’s ~85x larger Revenue base and ii) vastly different vertical exposure.
2) Gross Google Properties Revenue: Within Core Google is Google Properties Revenue which includes core Search and YouTube. We are looking for $28.07B in Gross Google Properties Revenue, up 9% Y/Y. We believe Google over-indexes in many categories hit hard by COVID-19 (Travel, Auto, Restaurants) and has material SMB exposure. 3) Revenue for Google Other: We are looking for $6.0B in Google Other Revenue, which would represent 10% Y/Y growth. Google Other Revenues includes Hardware, YT subscriptions, Play, and Cloud. 4) TAC: In terms of TAC, we are generally modeling muted ongoing growth in TAC (-20bps Q/Q to 22.2%).
Despite the obvious headwinds with an expected soft advertising market for months if not quarters to come, Wall Street analyst remain overwhelmingly bullish on the stock with 41 Buy ratings, only 3 Holds and No Sells with an average 12-month price target of $1455.
I would expect some to step to the sidelines for Q2 and Q3 if the company’s guide is worse than expected, especially when you consider the stock’s recent relative strength to the broad market.
So what’s the trade?
I am hard-pressed to see the company able to offer the sort of visibility that could cause the stock to breakout above $1300 in a meaningful way.
If I were inclined to play for a retest of the uptrend I might consider a short-dated put spread:
Bearish Trade Idea: GOOGL ($1245) Buy May 1200 -1100 put spread for $20
-Buy to open 1 May 1200 put for $25
-Sell to open 1 May 1100 put at $5
Break-even on May expiration:
Profits of up to 80 between 1180 and 1100 with max gain of 80 at 1100 or lower
Losses of up to 20 between 1180 and 1200 with max loss of 20 above 1200.
Rationale: this trade idea risks less than 2% of the stock price, has a break-even down 5% inline with the implied earnings move and has a max gain of 6.4% of the stock price down 11.6% in the next two weeks.
OR
Bullish Trade Idea:
If I were looking for defined risk long exposure playing for a breakout above $1300 post results I might merely buy a call or a call spread in May. For instance, vs $1245, the May 1300 call is about $20, less than 2% of the stock price, breaks-even at $1320, up 6%. Or the May 1300-1350 call spread costs about $11, or less than 1% of the stock price and has a max potential payout of $39, nearly 4x the premium paid for the spread up 8.4%.