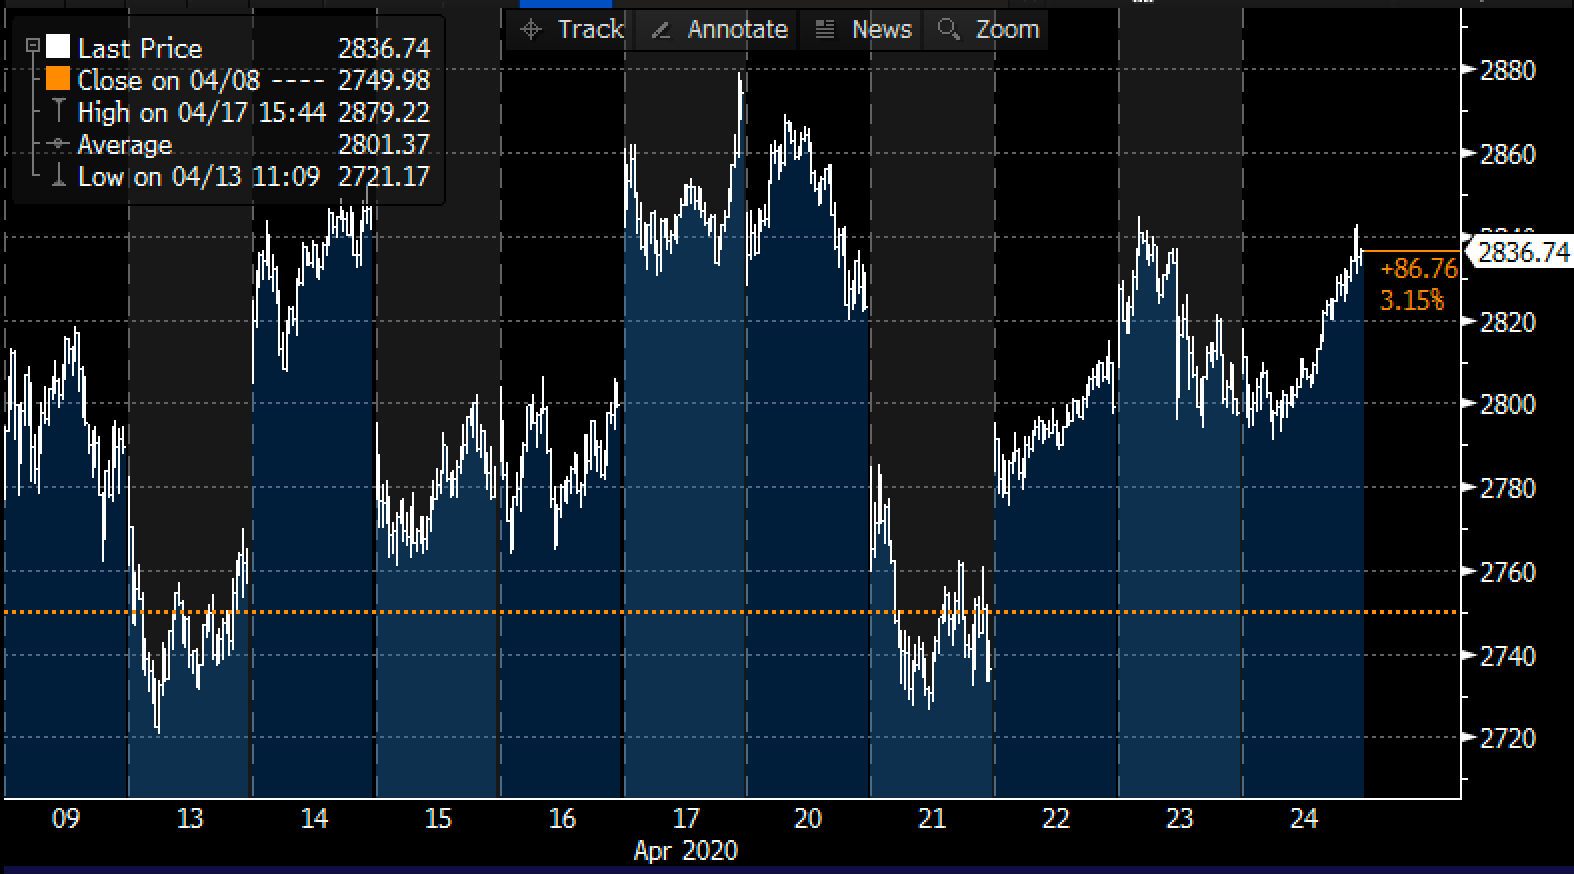
The S&P 500 (SPX) is up nearly 30% from its March 23rd lows, but down only 12% on the year and down only 16% from its all-time highs made on February 19th. Regular readers, Fast Money viewers and those who can stand my Tweets know that I think this price action is completely disconnected from the economic realities of the price of dealing with the pandemic, regardless of the speed and magnitude of the Fed and Treasury’s assistance:
The SPX (a mugs game for now) is nearly at the midpoint of the 2-month range. In 2019, w/ growth waning from trade war, the Fed induced a 20% rally via rate cuts & QE, then 35% black swan crash due to Covid-19, now a 30% Fed-induced rally. Higher we go the worse the retest I fear pic.twitter.com/9bp2TghuuZ
— Dan Nathan (@RiskReversal) April 25, 2020
As we head into a massive week for earnings with F’ MAGA (Facebook, Microsoft, Apple, Google, Amazon) all reporting, or 20% of the index, we just may get some sort of resolution to the SPX’s two week, 110 point trading range it is stuck in:
Over the weekend in his weekly column, CNBC’s superb market analyst and host Mike Santoli tried Making sense of a stock market just 16% off its high while a pandemic costs 26 million jobs
A question keeps echoing: “Why aren’t stocks down more?” implying the market’s too optimistic about a recovery. Yet the parts of the market geared to such a recovery haven’t been leading. A perceived Main St/Wall St divide might not be so wide. New column. https://t.co/lnvaTc6XBv
— Michael Santoli (@michaelsantoli) April 25, 2020
Mike highlighted F’ MAGA’s concentration in the SPX:
And at some point, the extreme reliance on the mega-cap growth leaders can go too far. The five largest stocks already make up more than 20% of the S&P, pushing record concentration at the top.
Flows into the ETFS that track the Nasdaq 100, technology, healthcare and utilities have reached extremes, a sign they are getting a bit overheated and are prone to backing off.
I would add that F’ MAGA has a 45% weight in the Nasdaq 100.
This tweet from @ChiGrl was making the rounds two weeks ago highlighting just how extreme the concentration of this group is in historical terms:
S&P500 now more concentrated in the 5 largest stocks than ever $MSFT $AAPL $FB $GOOGL $AMZN pic.twitter.com/0W1mMCWQ59
— ??? ?️ (@chigrl) April 17, 2020
On Friday’s Fast Money on CNBC, my pal Carter Worth of Cornerstone Macro Research also made this point as we head into earnings for the group:
Something could happen next week that’s only happened twice in history – and it could spell trouble for stocks, warns Chart Master @CarterBWorth of @csm_research. pic.twitter.com/SlSy9AvX8V
— CNBC’s Fast Money (@CNBCFastMoney) April 24, 2020
The outperformance in the Nasdaq / Nasdaq 100 is truly remarkable down less than 4% on the year, levitating on a relative basis as a result of AMZN’s 30% & MSFT’s 10.7% year to date gains on a collective $2.5 trillion in market cap, while AAPL is down only 3.5% on the year after 2019’s 85% annual gain while GOOGL is down just 4.5% in 2020.
Below is a quick table of the options market’s expectations for movement in F’ MAGA. To calculate the implied movement, I am taking Friday’s closing price of each stock’s weekly at the money straddle expiring this Friday, May 1 (the call premium + the put premium), and dividing by the stock price. This is the implied weekly movement for each stock… if you bought that, and thus the implied move for the week you would need a rally above the stock price greater the straddle premium, or a decline of the stock price greater than the straddle premium to make money by Fridays’ close. Most of the inflated straddle premium is to compensate market makers for the uncertainty of the one-day post-earnings reaction, so most of the implied weekly movement is for earnings, but for the most part, I would assume the one day move is about a full percentage point lower for just the one-day post-earnings move.
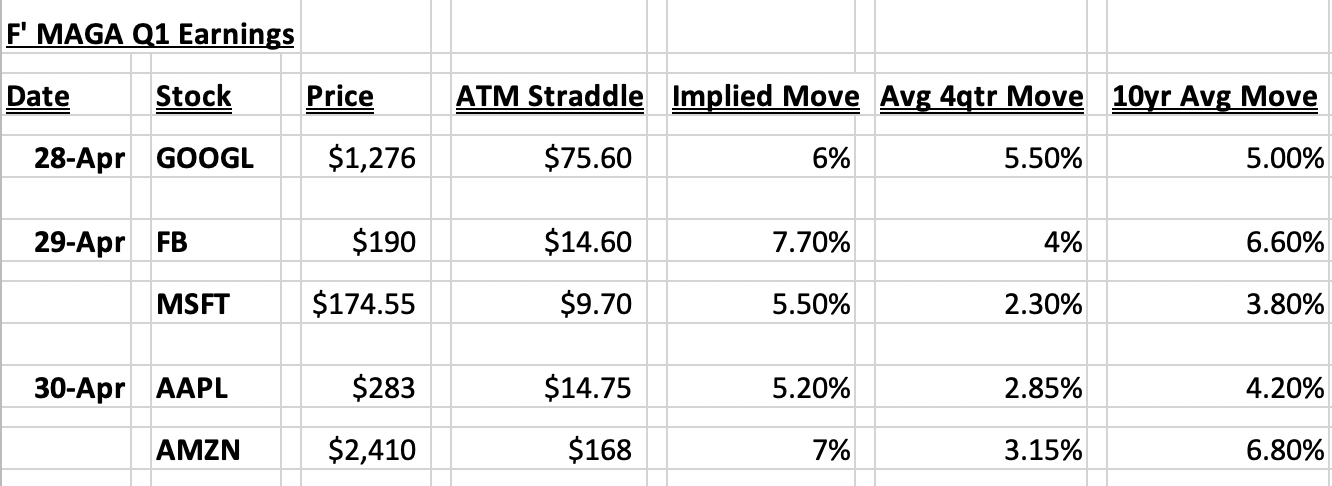
The likelihood of all five of these stocks all going in the same direction after earnings is not great, but if they were they are a combined $5.1 trillion in market cap and would certainly take the market in either direction with it. That being said they are more likely to move less than the options market is expecting individually on the week and in many cases cancel each other out. There is always the possibility that longs take the advantage of gaps higher to take profits after such a big run with the expectation that the next two quarters will be worse than Q1, while those who missed buying these beloved names in late March use weakness post-earnings to get long, thus muting extreme movement by day end post results.
Stay tuned ill be sure to go into greater detail in most of these names prior to earnings.