This morning Citi equity research initiated coverage of the homebuilder sector in an 85-page report, most with Buy ratings… here’s the tl;dr:
The final bit about what’s different this time is fair, however long and deep the impending downturn in the economy, the housing market had nothing to do with it this time.
But what is also different this time is the what is likely to be very long-lasting effects of so many small businesses not being able to weather the storm of the shutdown, and so many large businesses who will come to the realization in the months/quarters to come that they are overstaffed and this will lead to unemployment levels far higher than we have become accustomed to since the darkest days of the great recession.
It makes sense that homebuilders have been one of the hardest-hit groups in the market, despite rates being so low, investors immediately priced in the prospects for a massive slowdown in new orders in the face of a prolonged lockdown and what is likely to be a massive consumer liquidity crunch with unemployment expected to rise precipitously with little visibility for most of 2020 and what will also likely be a period consumer de-leveraging in the months/years to come.
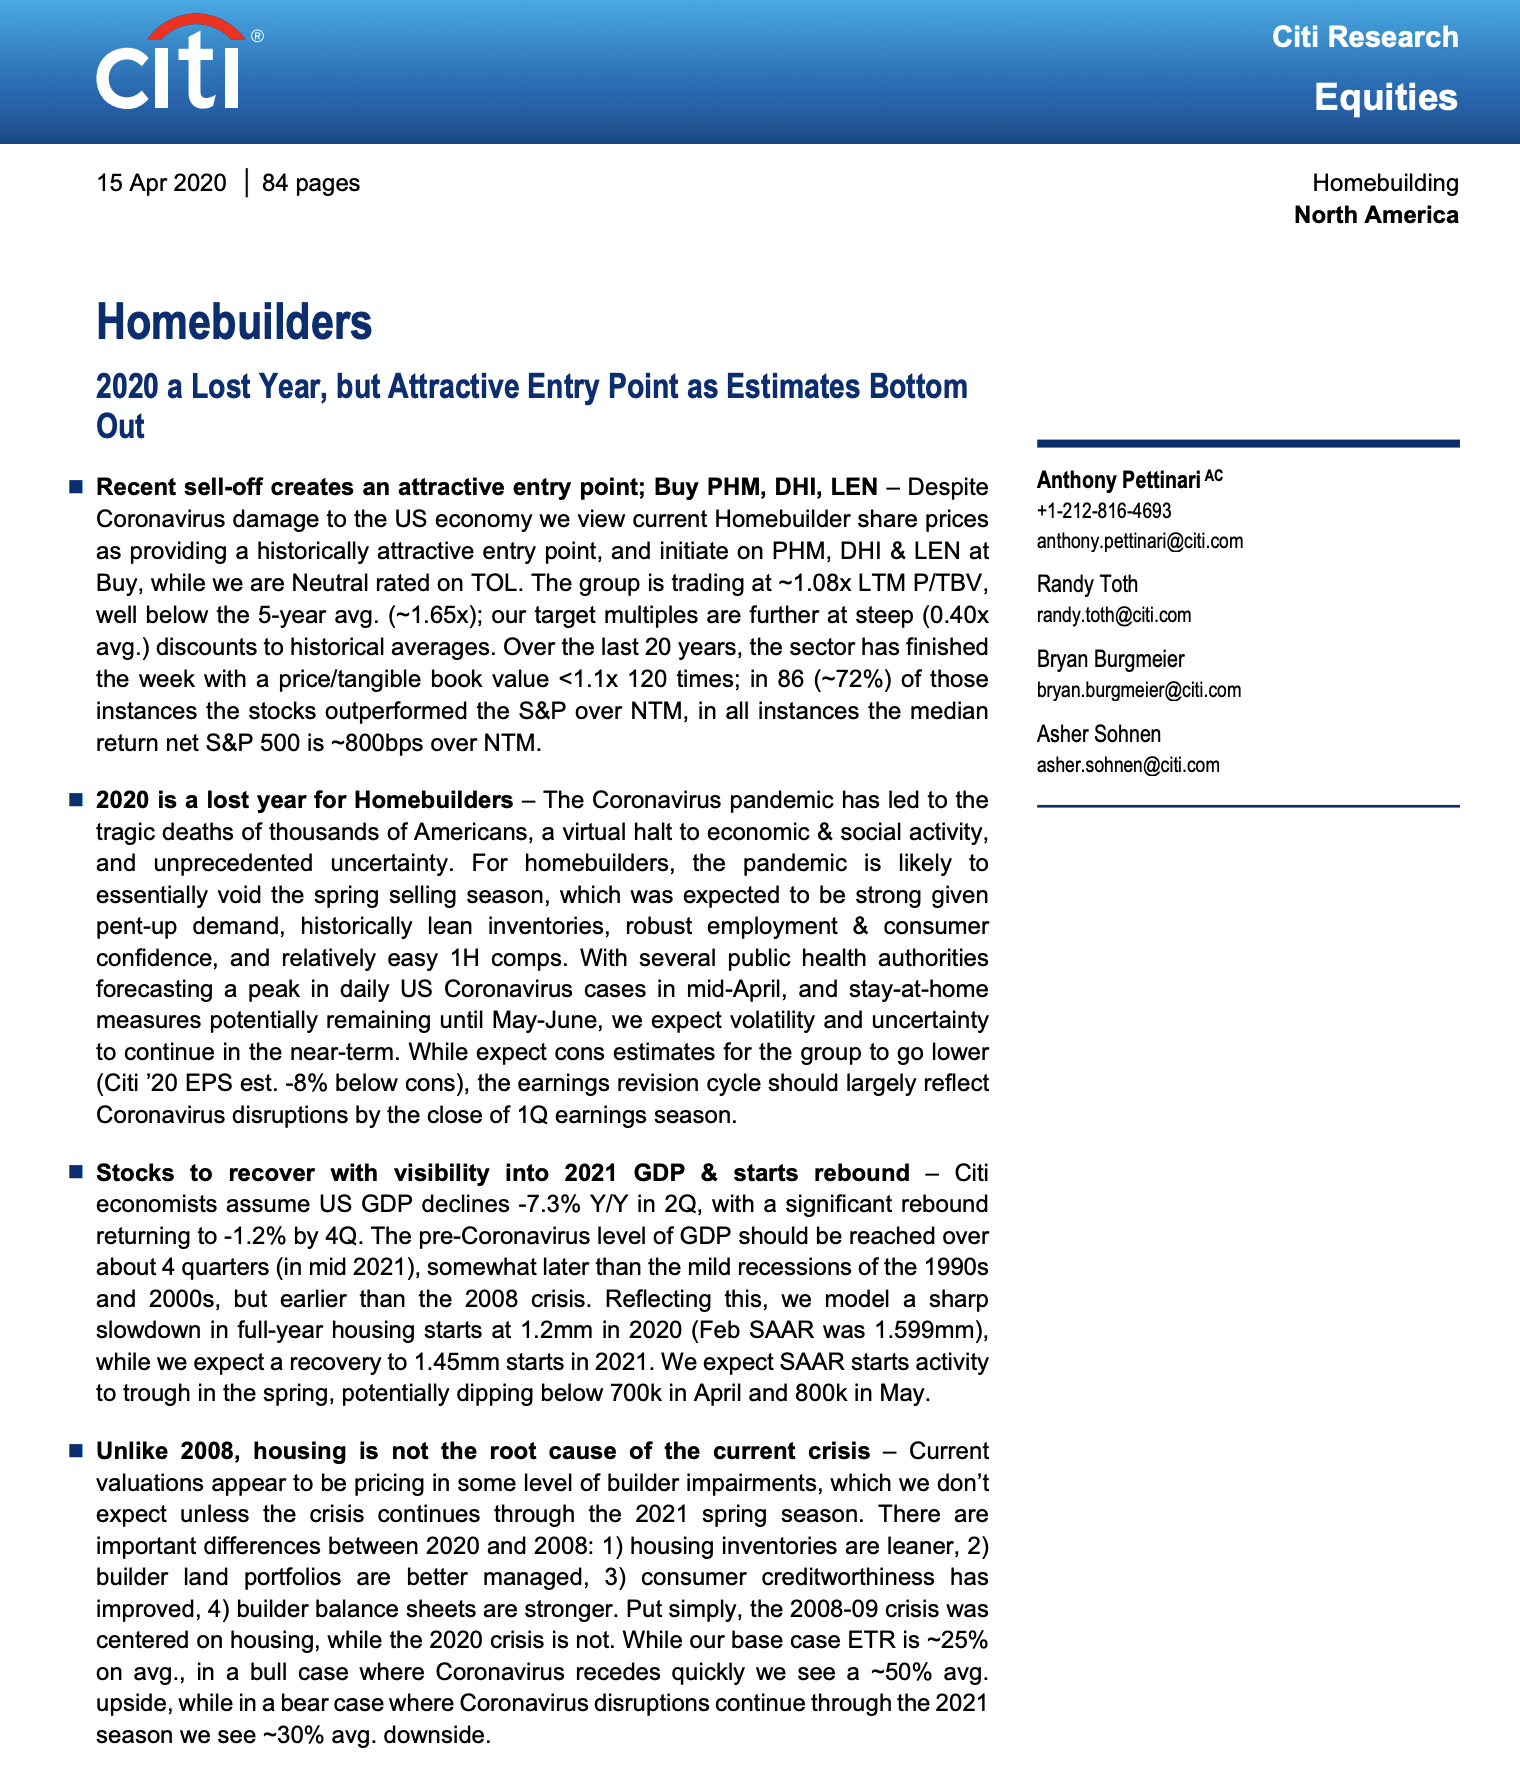
The iShares Homebuilder and Construction etf dropped 55% from its highs in late February to its lows in late March, but has since come back a bit, and is now down 26% on the year. What’s interesting to note when looking at the chart from the start of 2019 is that the sector bore out of a 4-month consolidation in August, immediately after the Fed cut interest rates for the first time in ten years, for that at the time they were calling a mid-cycle adjustment helped on by the Fed’s two additional 25 basis point cuts in the back half of the year coupled with “repo operations” that amounted to nearly $80 billion a month in asset purchases by the Fed aka QE. From the start of the Fed easing in August to mid-Feb, the ITB rallied 25% in a nice 45-degree angle, until the Virus started spreading in the U.S.:
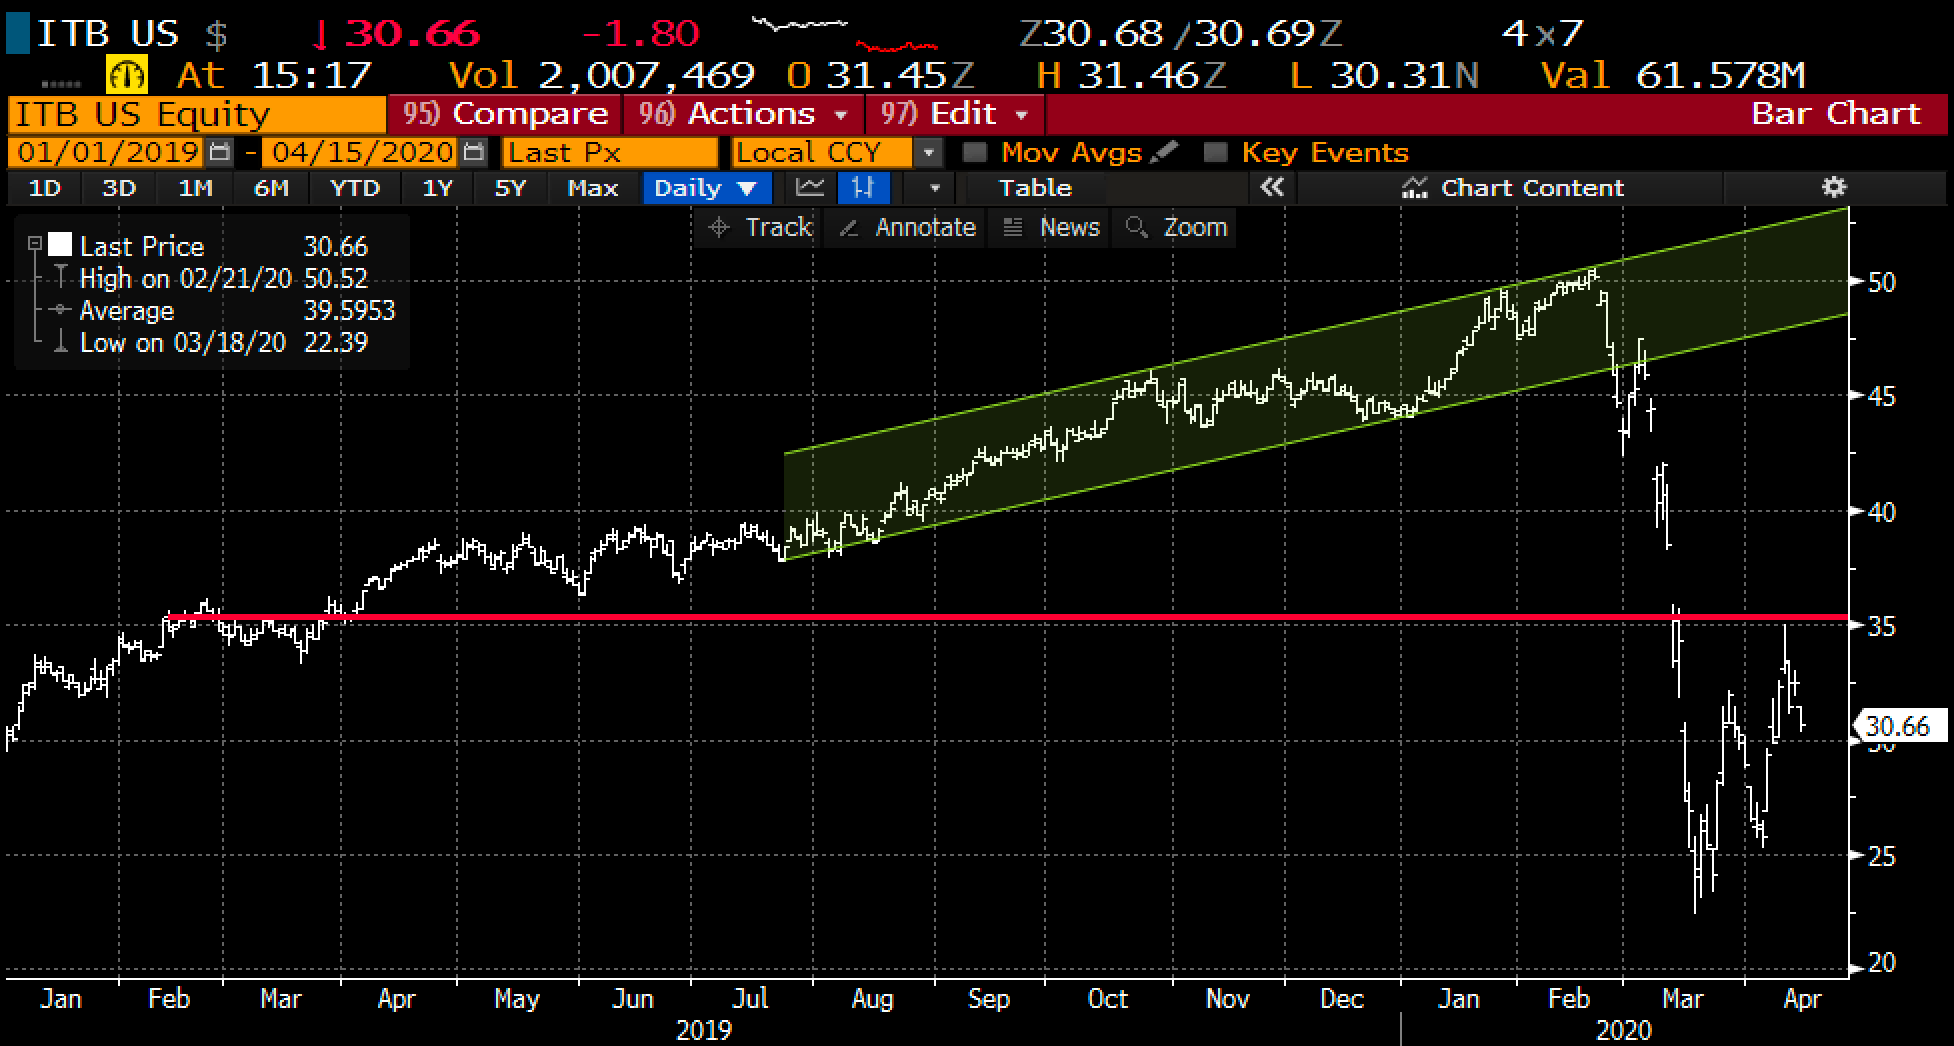
The five-year chart of the ITB shows the stock straddling $30, and important support level, with obviously long term support near the March lows, which were just above the early 2016 lows at $21.61:
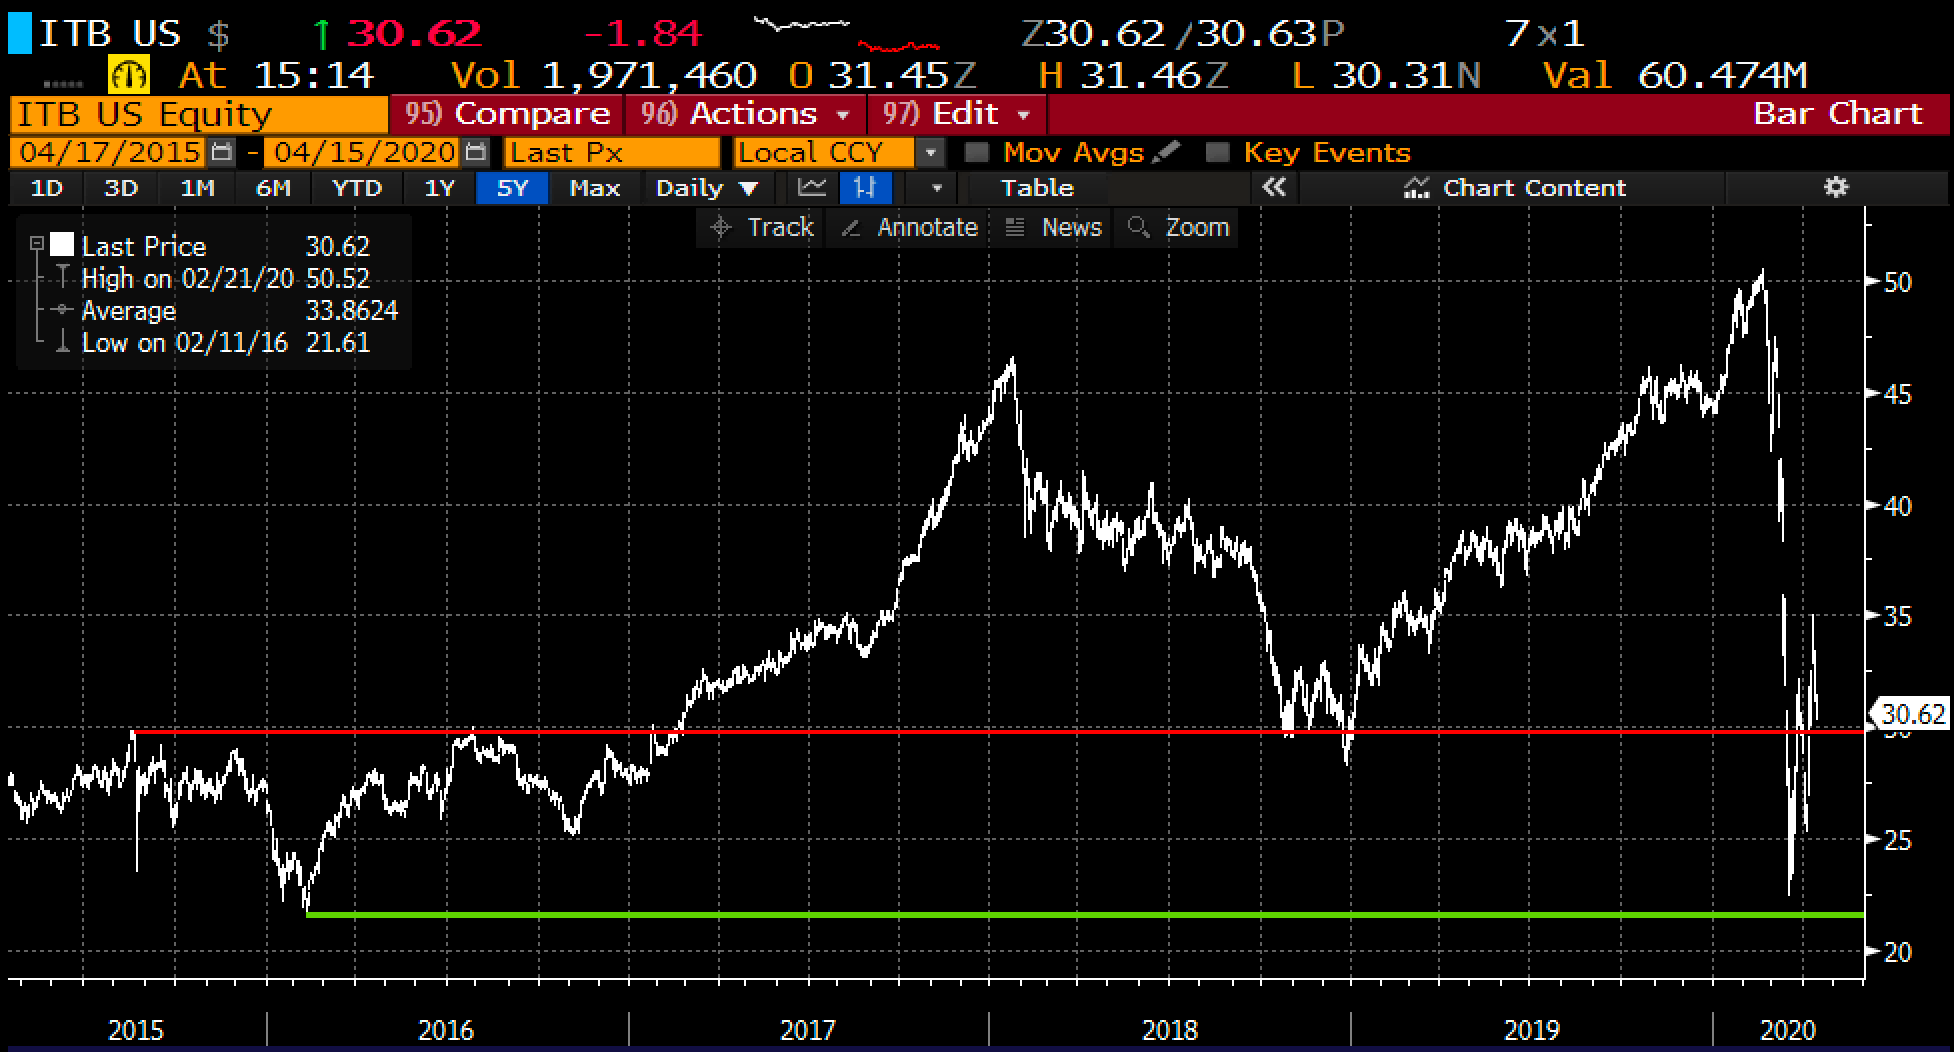
Short-dated options prices, despite being well off of their recent highs are still up 200% from the prior year’s average, making long premium directional strategies look less than attractive
But If I were inclined to pick a direction, it would be lower, and if I were to do with options I would use spreads, for instance:
Bearish Trade Idea: ITB ($30.60) Buy July 30 – 20 Put Spread for $2.30
-Buy to open 1 July 30 put for 2.80
-Sell to open 1 July 20 put at 50 cents
Break-even on July expiration:
Profits of up to 7.70 between 27.70 and 20 with max gain of 7.70 below 20.
Losses of up to 2.30 between 27.70 and 30 with max loss of 2.30 above 30
Rationale: this trade idea breaks-even down ~9.5%, risks 7.5% of the etf price, and offers profit potential of up to 25% if the etf os down 35% in 3 months. know that sounds like a lot, but it is worth noting that the stocks low was 22.40 last month.