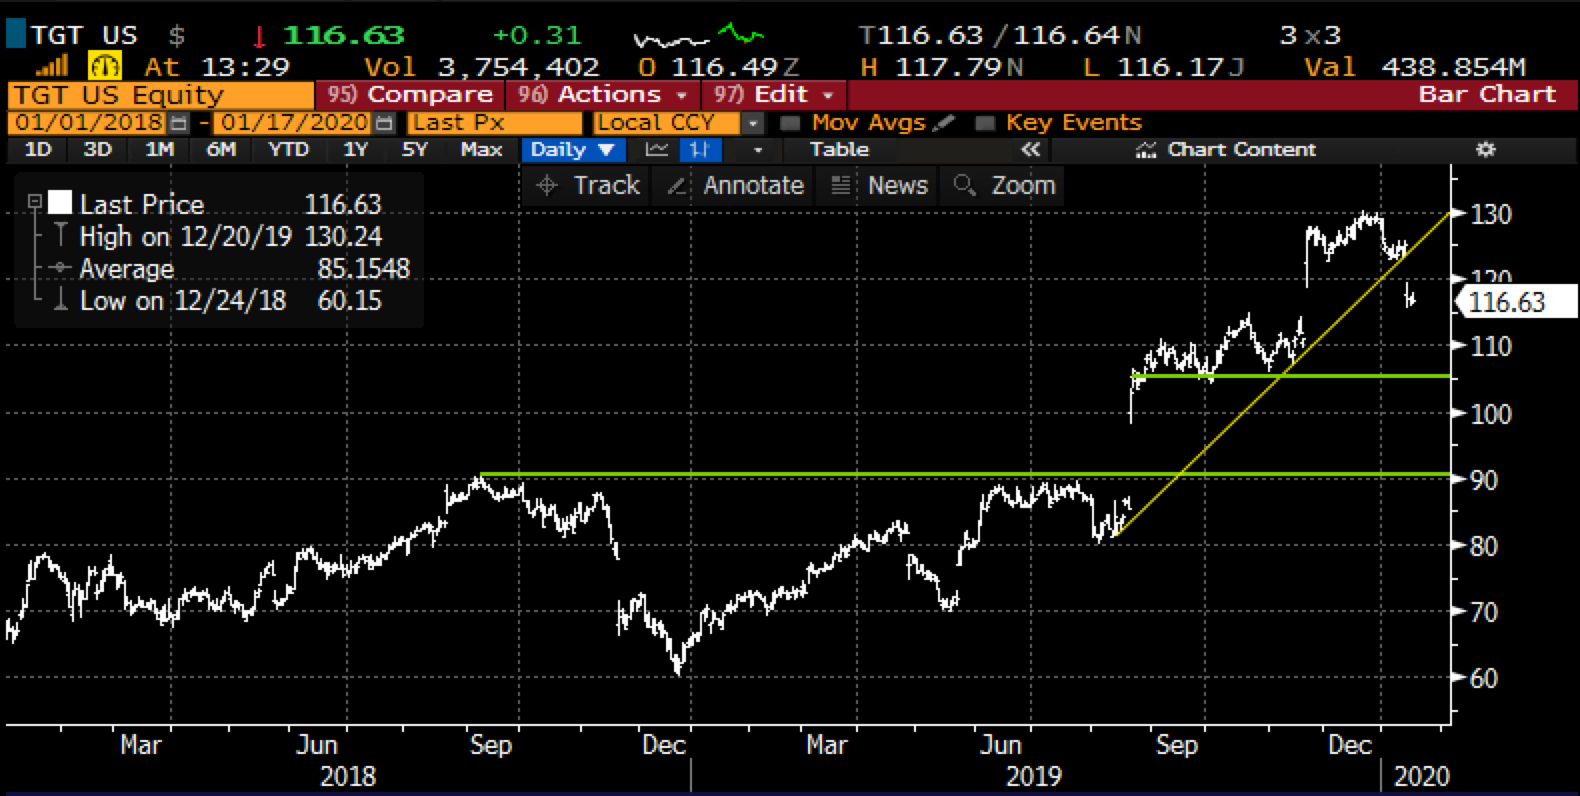
In August shares of Target (TGT) broke out to a new all-time high, trading up 20% the day following their Q2 earnings. After consolidating for nearly three months, holding all of the gains, the stock broke out again to a new all-time high, rallying 14% the day after their Q3 results in late November. Earlier this week, after two consecutive beat and raises, the company guided down for the current quarter, per WSJ:
Target’s November-December sales rose 1.4% for stores and digital channels operating for at least 12 months, the company said Wednesday. It warned that growth for its full fiscal fourth quarter, which includes January, would likely fall short of the 3% to 4% gain it previously predicted.
“We faced challenges throughout November and December in key seasonal merchandise categories and our holiday sales did not meet our expectations,” said Chief Executive Brian Cornell, who after taking the helm in 2017 launched a plan that included store remodeling and investment in Target’s digital platform.
The stock traded down 7% on Wednesday, closing below the uptrend that had been in place since the summer:

The company will offer its full Q4 results in the first week of March.
Despite TGT’s strong gains in 2019, with the stock down 10% so far in 2020, it trades cheap to its big-box peers at 16.7x fiscal 2021, vs Walmart (WMT) at 22x and Costco (COST) at 32x. It is worth noting that Wall Street analysts expected TGT’s EPS growth to materially decelerate from 19% in fiscal 2020 to 9% in fiscal 2021, while sales growth is expected to moderate from 5% in 2020 to 3% in 2021.
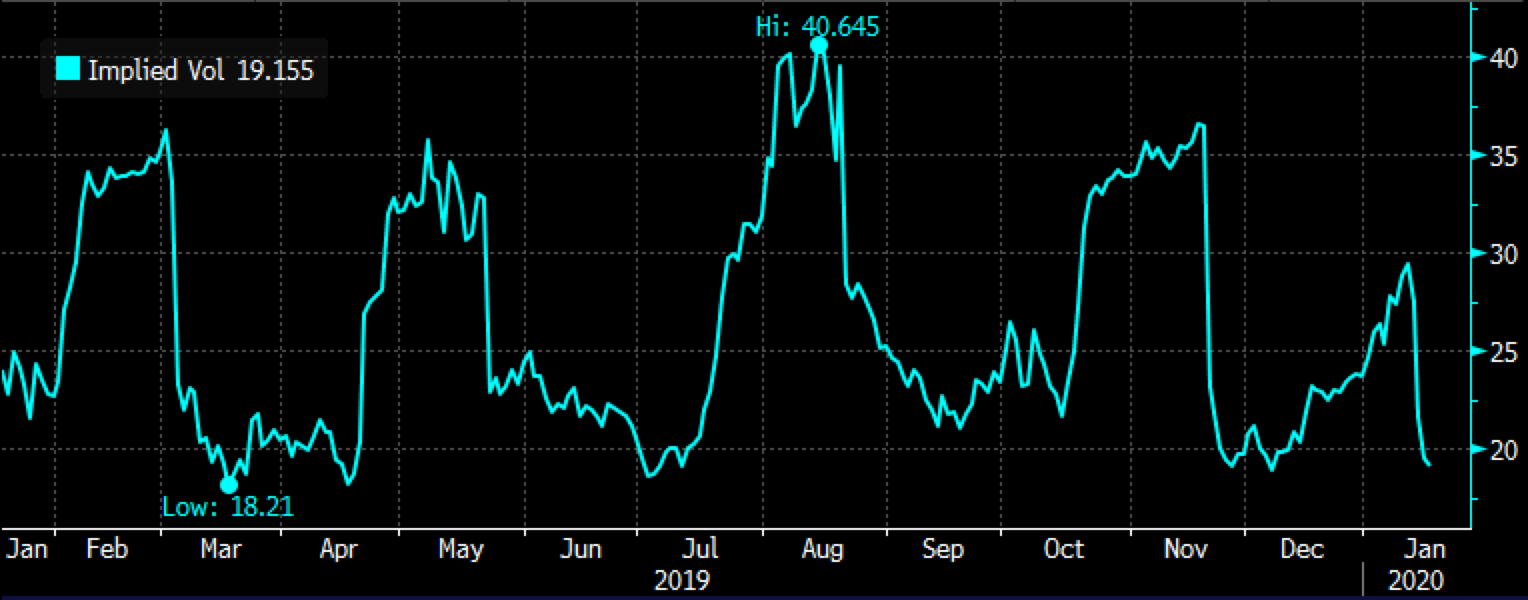
Short-dated options prices have come in hard this week with some of the earnings news out of the way… read this as options market makers view the stock as less risky after the news. This makes sense, despite the news not being great it is one less thing for investors to surprised about in the future. 30-day at the money implied volatility just above 19% is 1 point from its 52-week lows, suggesting that for those looking to express a directional view in TGT can do so via long options without too much worry of overpaying for premiums:

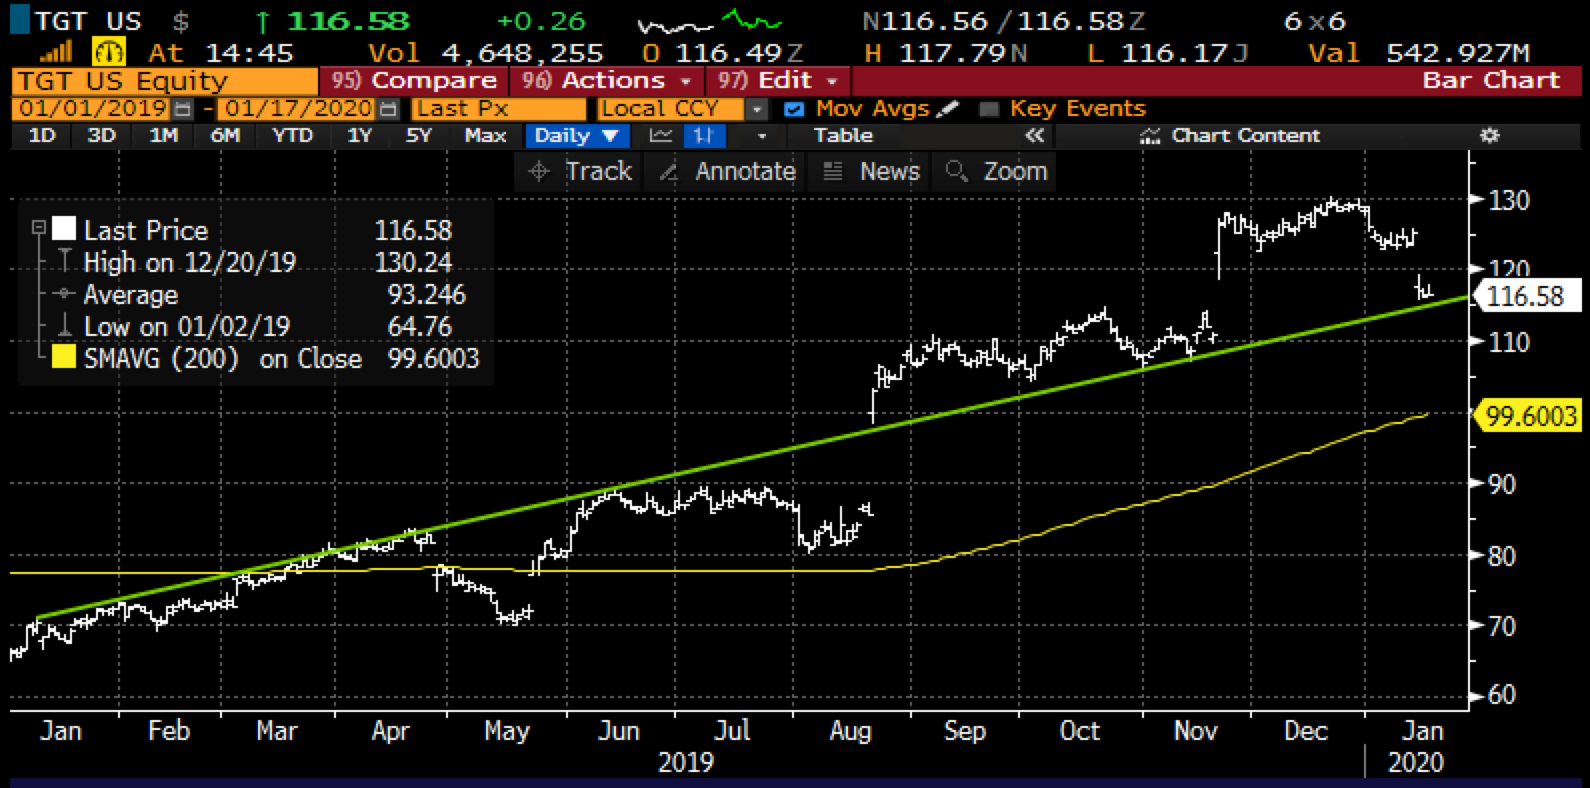
So what’s the trade? Let’s go back to the chart, below is the one year, you see that nice uptrend… former resistance in the first half of 2019 has now become support, but the stock is at a crucial technical spot.

interestingly, the stock is nearly at the midpoint of downside support, the Aug gap level near $100 that is also the stock’s 200-day moving average, and the $130 all-time high made in Dec.
If I were inclined to play for a hold at support and a grind back to the prior highs I might consider the following trade idea:
Bullish Trade Idea; TGT ($116.50) Buy March 120 – 130 call spread for $2.50
-buy to open 1 March 120 call for 3.50
-sell to open 1 March 130 call at 1
Break-even on March expiration:
Profits of up to 7.50 between 122.50 and 130 with max gain of 7.50 at 130 or higher
Losses of up to 2.50 between 120 and 122.50 with max loss of 2.50 at 120 or lower.
Or
If I were inclined to play for continued weakness, a break below the uptrend and move back to intermediate-term support near $100, I might consider the following put spread:
Bearish Trade Idea: TGT ($116.65) Buy March 115 / 100 put spread for $3.80
-Buy to open 1 Mar 115 put for 4.50
-Sell to open 1 Mar 100 put at 70 cents
Break-even on March expiration:
Profits of up to 11.20 between 111.20 and 100 with max gain fo 11.20 at 100 or lower.
Losses of up to 3.80 between 111.20 and 115 with max loss of 3.80