Yesterday I shot my second installment of In The Money with Fidelity Investments (watch here):
Tune in to IN THE MONEY as CNBC contributor and options strategist Dan Nathan talks earnings from the largest banks and his most important stock of the week: https://t.co/RRdAHds7r3 pic.twitter.com/m3FKcQRE5z
— Fidelity Investments (@Fidelity) January 15, 2020
IN the video we discussed how investors bought the rumor of the Phase 1 trade “deal” with China, will they now Sell the News?? We also discussed the solid results from JP Morgan (JPM) and Citigroup (C) and I detailed two options strategies using the XLF, the ETF that tracks U.S. Banks, one bearish for those looking to either protect existing bank stocks, looking out to June expiration, and one bullish looking to play for more near-term momentum to the upside between now and March expiration.
My main takeaway was simple, no matter what your existing bank holdings re, or your directional inclination, after such a sharp rally from early October, XLF options are cheap in vol and dollar terms.
Here are the two ideas when the XLF was $31 yesterday:
Bearish Trade Idea: XLF ($31) Buy June 30 put for 95 cents
-Profits below 29.05, down nearly 6%…
-Losses of up to 95 cents between 30 and 29.05 with max loss of 95 cents above 30… risk 3% of the ETF price for 5 months.
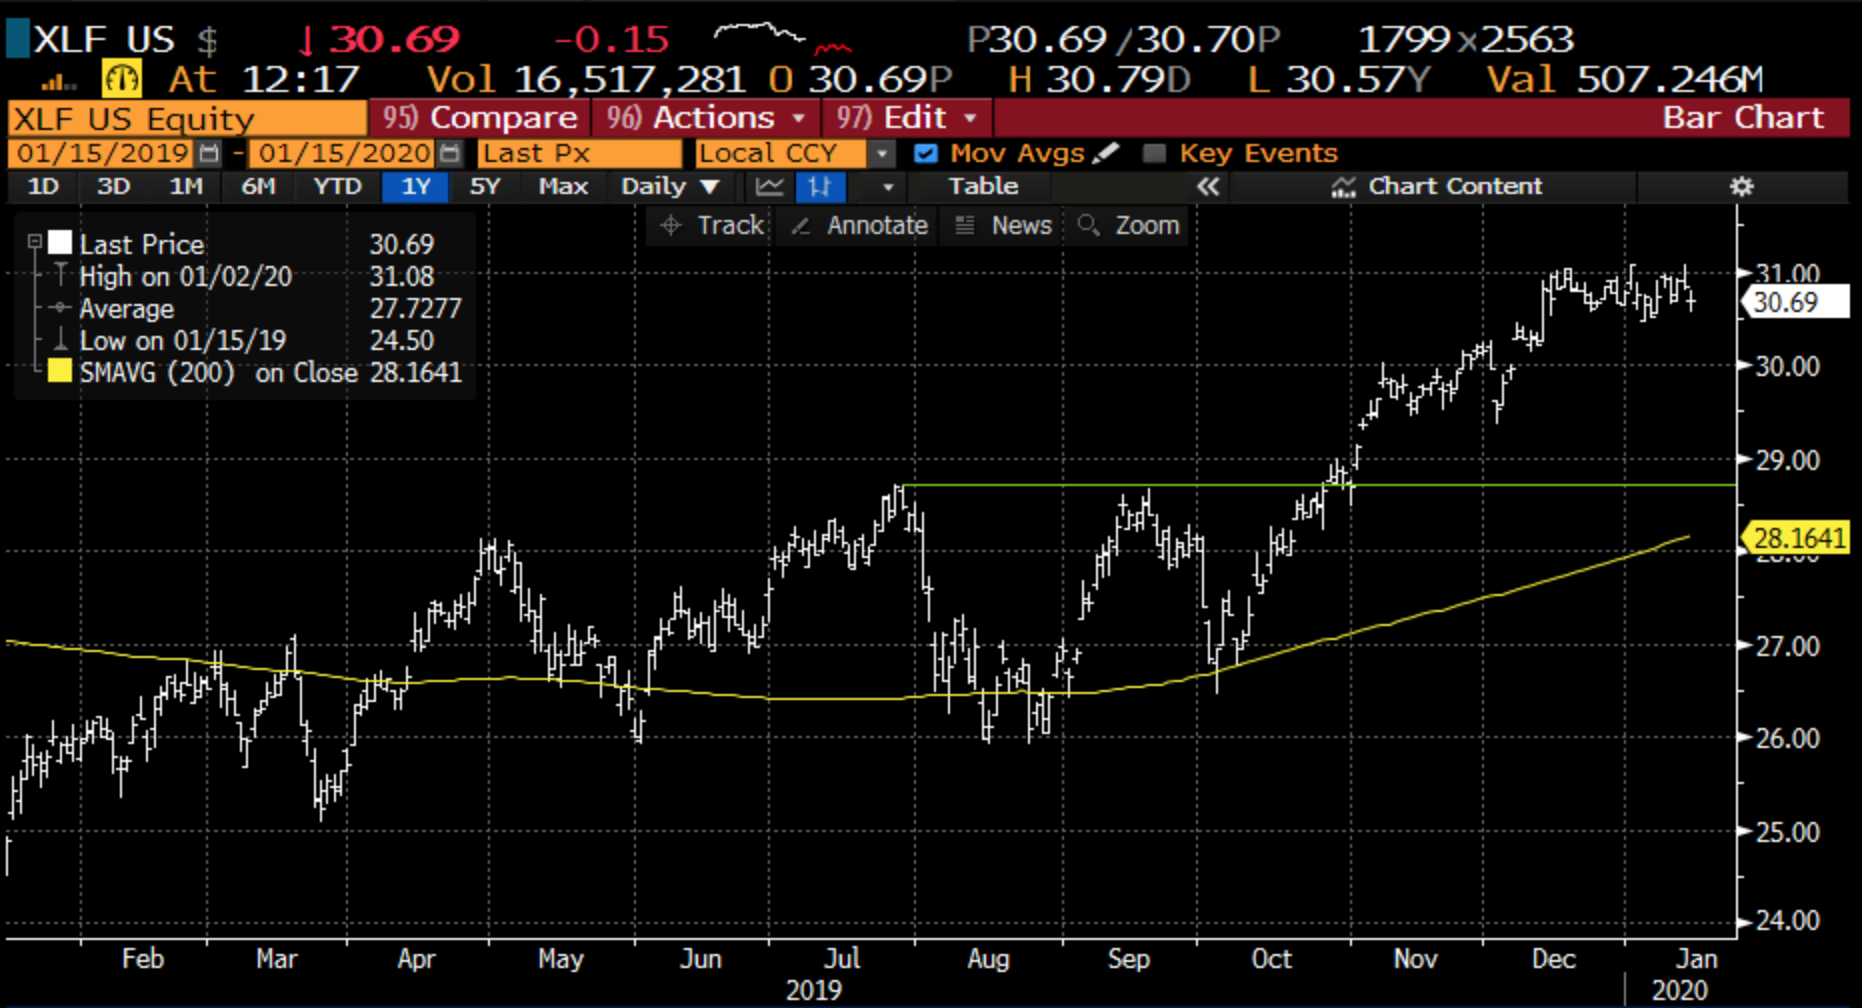
To my eye, the XLF has decent near-term support between $28 and $29, the breakout level from late October, but also near its 200-day moving average, below that and we are back near the summer lows around $26:
Or
Bullish Trade Idea… XLF ($31) Buy March 31 call for 80 cents
-Profits above 31.80, up less than 3%
-Losses of up to 80 cents between 31 and 31.80, max loss of 80 cents below 31.
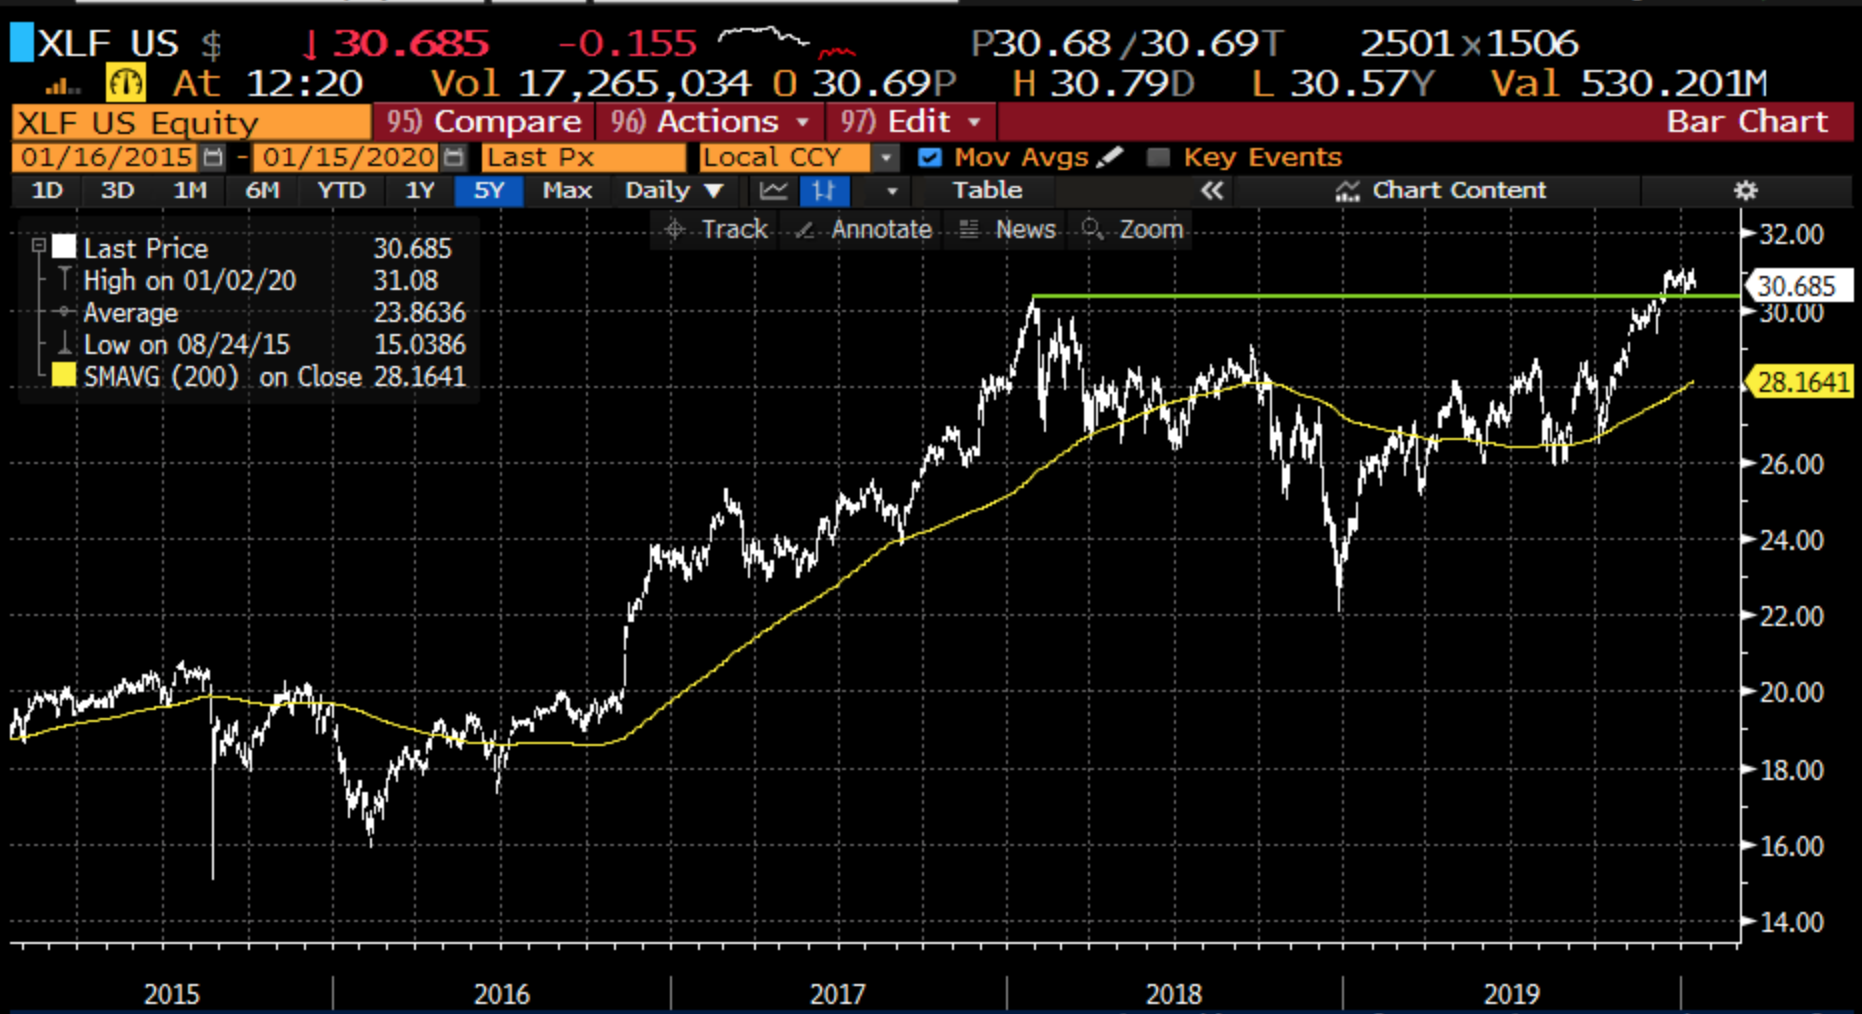
For those that think the recent consolidation above the Jan 2018 high is setting up for a move higher than defined risk short-dated calls are the way to play the group in my opinion.
Also, I walk through how I usually calculate implied movement using weekly at the money straddles (the call premium and the put premium) which regular readers are very familiar with. We used Schlumberger (SLB) which reports Friday morning as an example:
Schlumberger (SLB) will report Q4 earnings Friday morning before the open, the implied one day move in the options market is about 4% or $1.50. We can figure that out by taking the at the money straddle (the call premium of the nearest strike and the put premium) in the weekly options and add them together and divide by the strike price. So with SLB near $38.50, the Jan 17th 38.50 straddle would cost about $1.50 if you bought that and thus the implied movement between now and Friday’s close you would need either a rally above $40, or a decline below $7 to make money, or about 4% in either direction.
We also discussed that for those who have a directional bias, to buy the at the money call or put and express a directional view you would need just a 2% move or about 75 cents, but importantly, get the direction wrong and you likely have a total loser given the short-dated nature of such a trade.