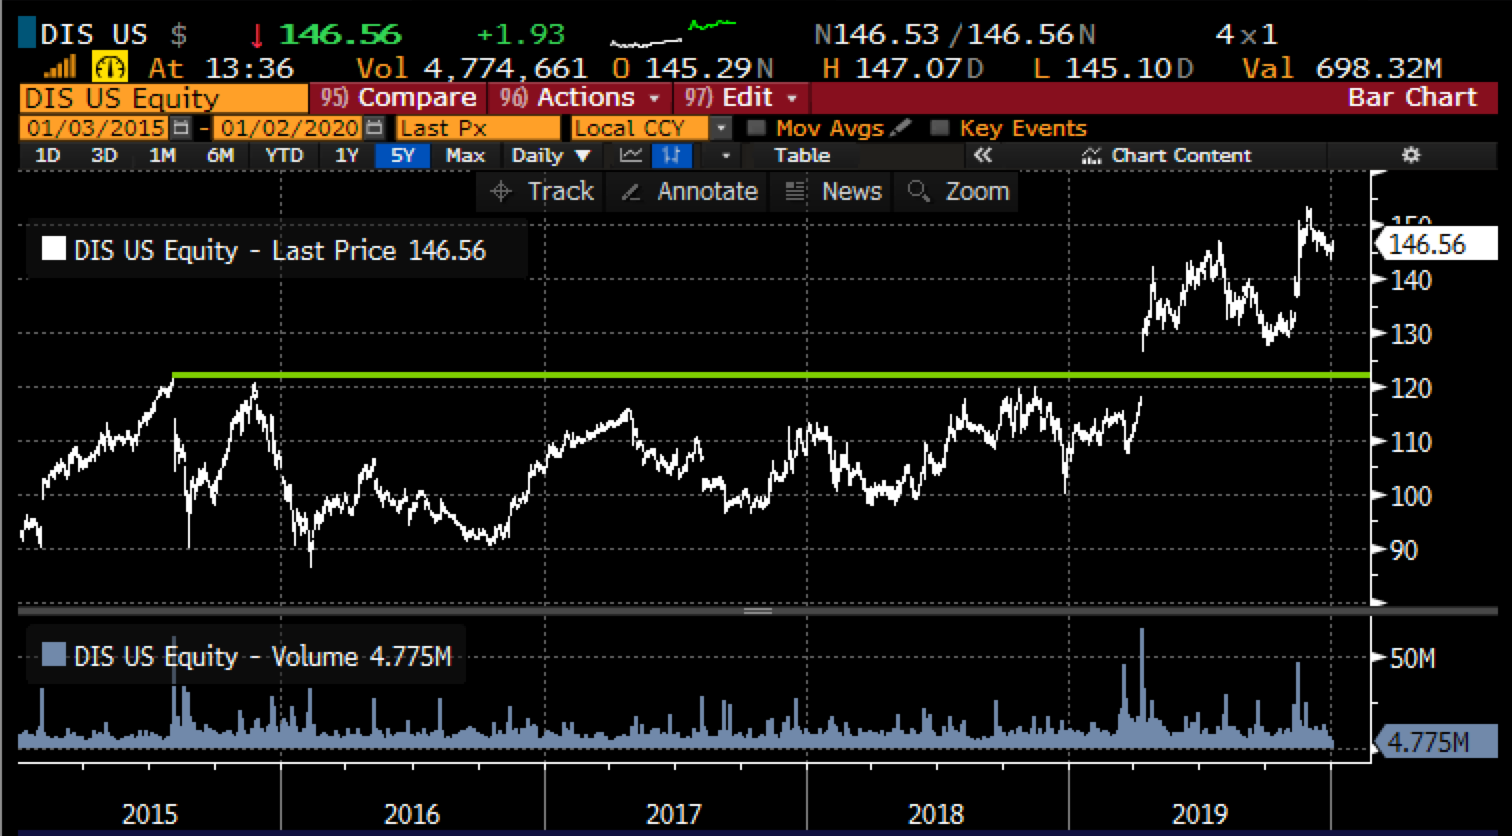
Large volume technical breakouts of long bases can be one of the most bullish chart patterns, where a flip can be switched, long term resistance becoming meaningful support. Last year shares of Disney (DIS) broke out above its 2015 high near $120, on massive volume, on long-anticipated details of their recently launched Disney + streaming service… and 8 months later the stock is up 20% from those levels:
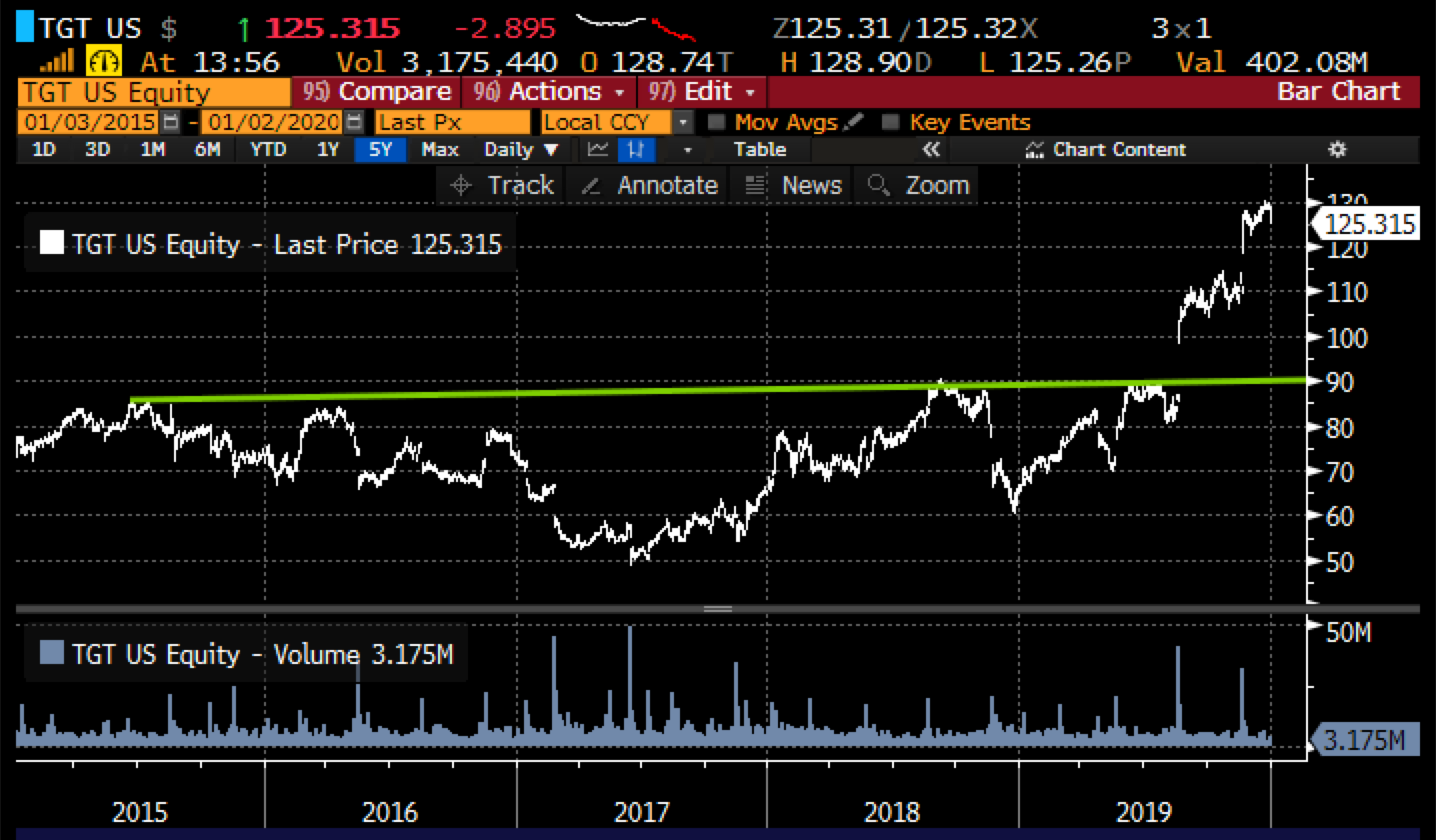
Fairly similar to DIS, shares of Target (TGT) spent the prior few years to its 2019 breakout underperforming many peers and stuck in a range. Two consecutive beat and raise quarters and the stock are up 30% in what seems like a straight line in six months:
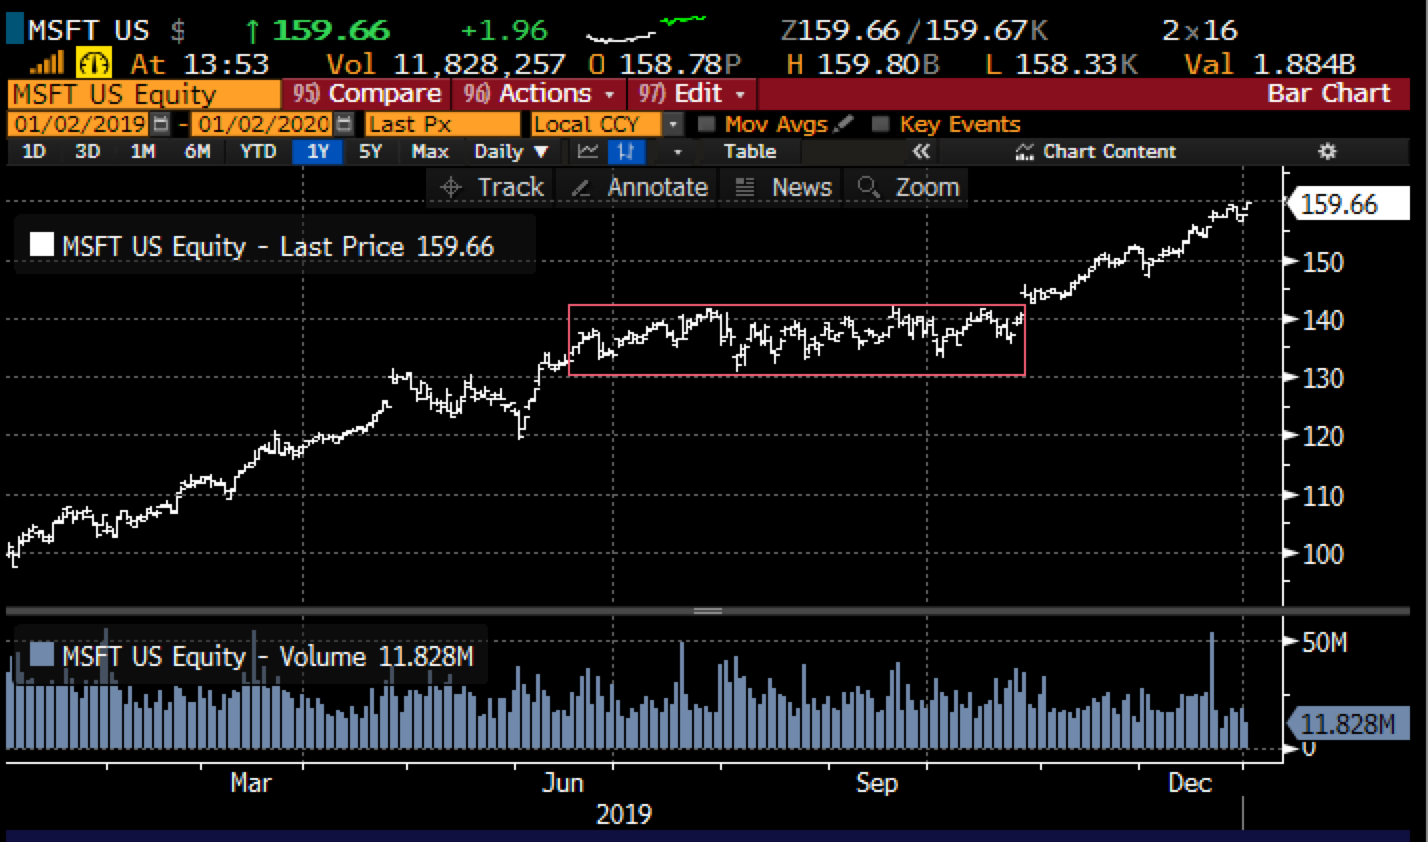
While the prior two examples show the effects of longterm tension relieved, this pattern can also work for shorter-term trading set-ups.
In 2019 after rising 30% in the first six months so the year, shares of Microsoft (MSFT) consolidated between $130 and $140 for most of the summer until its October breakout which has yielded 15% gains since:
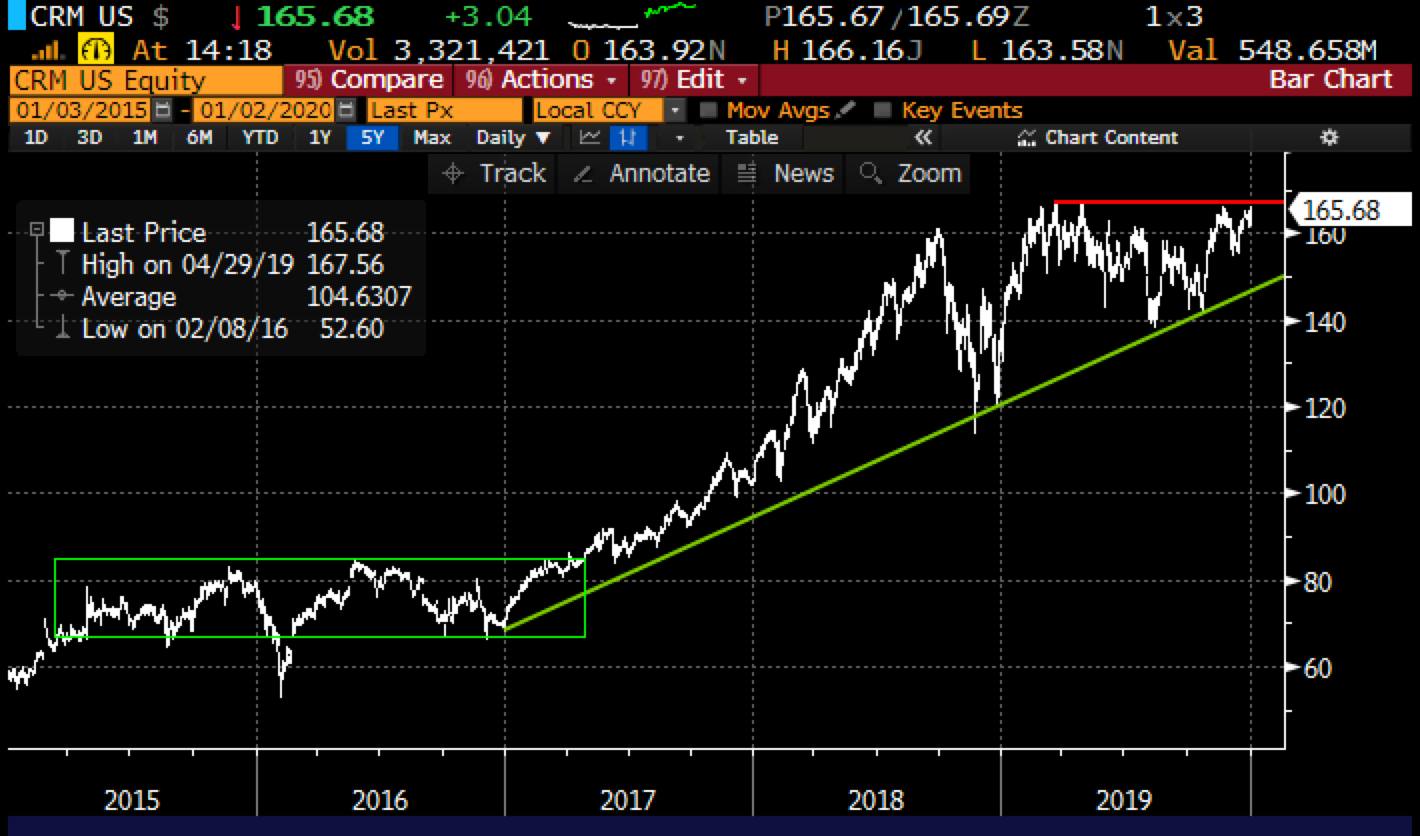
Which brings me to Salesforce.com (CRM), a stock that underperformed many of its mega-cap tech peers in 2019, closing up 19% vs the Nasdaq Composite up 2x that. The stock spent the better part of 2019 in a trading range between $145 and $165, and is now punching up against that level where the stock has been rejected a few times since last March:
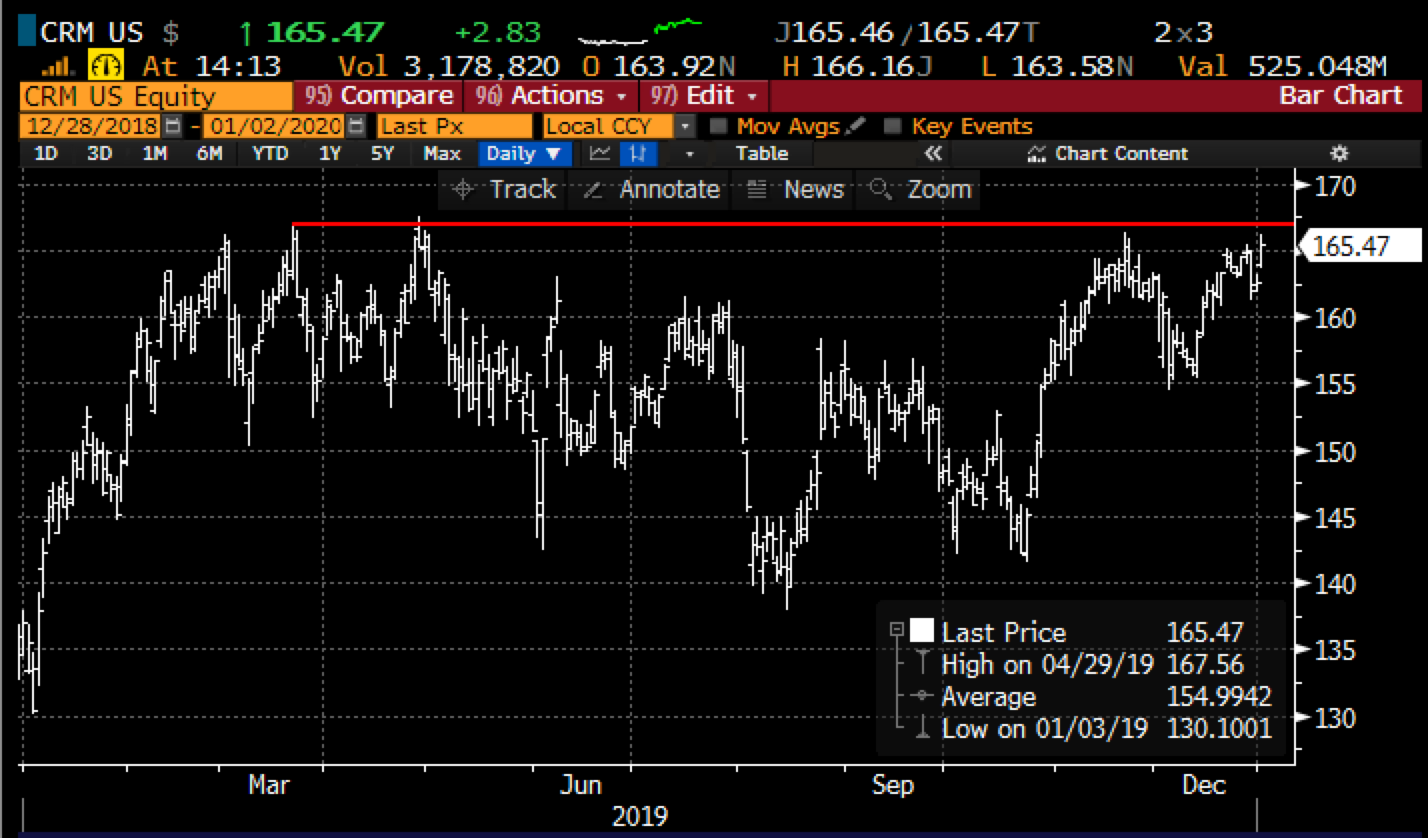
Why might the stock breakout in early 2020? Well in 2019 investors were certainly fine with multiples expanding on “growth at a reasonable price”, like Apple (AAPL) and MSFT, if the market were to continue its tear higher, investors will look to play catch in names that have underperformed and a high valuation, high growth name like CRM which fits in plenty of buzzy tech narratives will likely benefit, despite its rich valuation. It is also worth noting that in early 2017 after a multi-year consolidation, CRM broke out and has been up 100% since:
The next identifiable catalyst for CRM will be their fiscal Q4 results in the first week of March, I suspect a breakout would likely come prior in the event that the broad market continues higher. I would also add that there seems to be a big disconnect on the sentiment front between Wall Street analysts who have 39 Buy ratings, only 3 Holds, and no Sells, with an average 12-month price target of $190 and investors who have hit the pause button over the last nine-months.
The stock’s recent bounce from the multi-year uptrend near $145, suggests that it is the next level of support to the downside, down about 10%. Which brings me to how to play with defined risk, Short-dated options prices are as cheap as they have been in nearly two years, with 30-day at the money implied volatility at just below 21%:
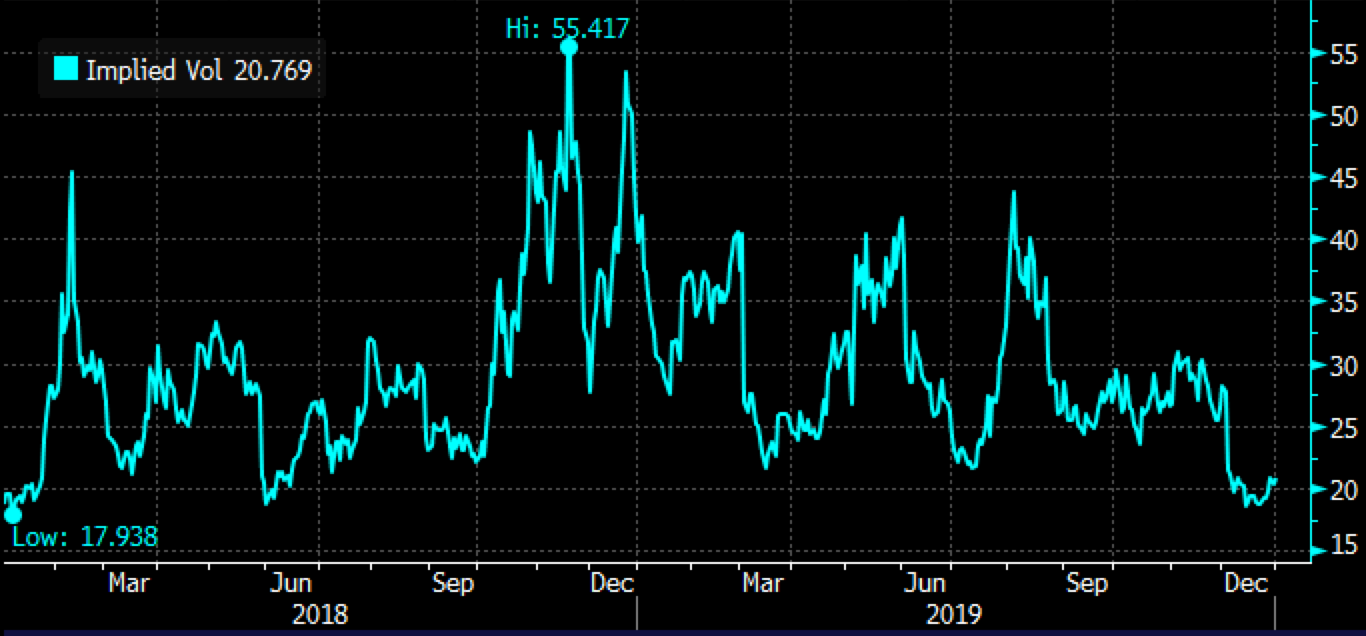
So what’s the trade? If I were looking to play for a breakout and a 10% rip following I might consider call spreads in Feb expiration:
Bullish Trade Idea: CRM ($166) Buy Feb 170 – 185 call spread for $3
-Buy to open 1 Feb 170 call for $3.40
-Sell to open 1 Feb 185 call at 40 cents
Break-even on Feb expiration:
Profits of up to 12 between 173 and 185 wth max gain of 12 at or above 185
Losses of up to 3 between 170 and 173 with max loss of 34 at 170 or lower.
Rationale: this trade idea risks 2% of the stock price, has a break-even up 4% and offers a max payout of 4x the premium at risk if the stock is up 11% on February expiration.
I would also add that the 185 call is not a great sale at just 40 cents, but it makes the math work fairly easy in describing the payout and could be a very attractive sale if the stock were to move higher and be in the money and could be sold near 1% the stock price. The options market is saying there is about a 40% chance that the Feb 170 call will be in the money on Feb expiration, but only a 10% chance the stock will be at 185.