Toll Brothers (TOL), America’s Luxury Home Builder, reports its fiscal Q4 results today after the close. The options market is implying about a 5.4% one-day post-earnings move, which is rich to the average over the last 4 quarters of about 3.25%, With the stock near $41.50, the Dec 13th 41.50 straddle (the call premium + the put premium) is offered at about $2.25, if you bought that and thus the implied movement you would need a rally above $43.75 or a decline below $39.25 to make money on Friday’s weekly expiration.
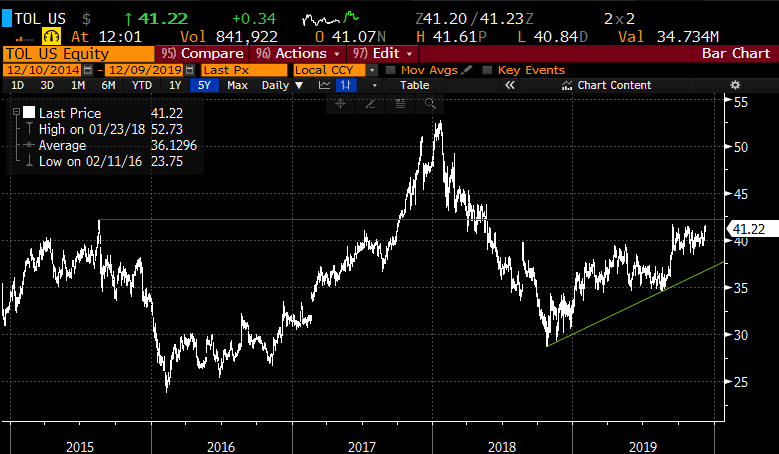
Shares of TOL are up 25% on the year, up in line with the S&P 500’s (SPX) YTD gains, but underperforming the 42% YTD gains of the XHB, the S&P Homebuilders ETF and the more pureplay that does not have home improvement retailers and suppliers, the ITB, iShares Homebuilders ETFs 51% YTD gains.
TOL has been in a fairly well-defined range since mid-September between $38 and $42, today threatening a breakout:
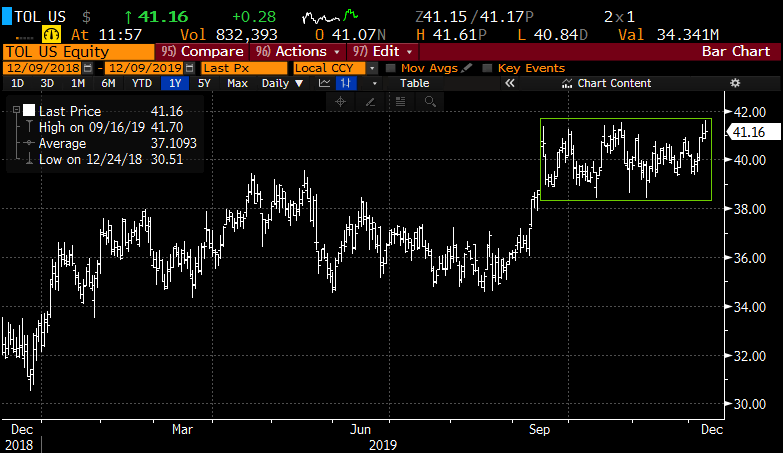
A breakout fo the current range would yield little overhead resistance till about $50:
When considering housing sentiment it makes sense to plot the direction of mortgage rates vs sales, the chart below shows the 30-year Mortgage rate vs New Home Sales over the last few years, most notable is the considerable drop in rates from last Q4 and the total of new home sales at multi-year highs. It is obviously worth noting that rates have been dropping all year, assisted dramatically by the Fed’s three consecutive 25 basis point cuts at FOMC meetings starting on July 31st:
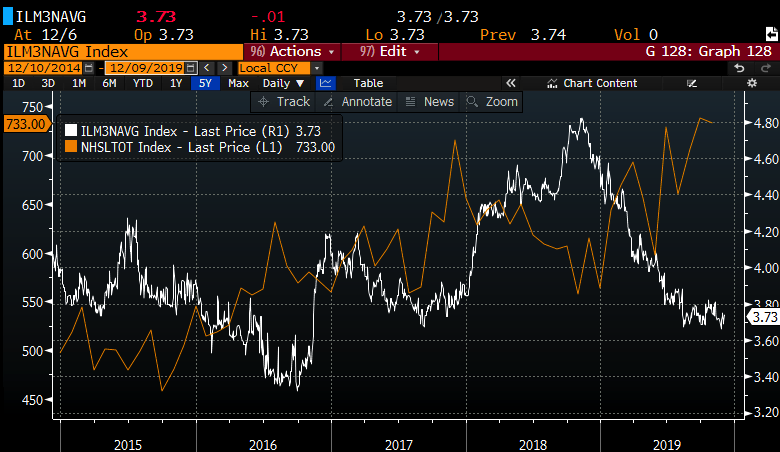
Given Friday’s better than expected Jobs data, many Fed watchers are suggesting that the Fed is clearly on hold on the cutting, and at their meeting this week, the last of the year the message might hint to a firmer rate environment. If rates were to start to raise as we saw in 2018 we would very likely see new home sales decline.
I suspect there is a scenario that some market participants might call “goldilocks” for homebuilders, where the economy is strong enough to keep new-home sales stable to higher, while macro conditions keep a lid on interest rates. In this scenario with the jobless rate at 50-year lows, and trump hoping to get elected next November, that every and all policy out of the admin will be geared towards keeping the U.S. economy strong, at any cost.
So what’s the trade? heading into the print tonight, short-dated options prices (implied volatility, the blue line below) are nearing 6-month highs at 32%, while realized volatility (how much the underlying is moving (white line below) is nearing 2019 lows, suggests that short-dated prices are expensive.
If I were inclined to play for a breakout, but within the hefty implied move, I might consider a call calendar, selling short-dated out of the money calls and using the proceeds to help fund the purchase of longer-dated out of the money calls of the same strike, for instance:
Bullish Trade Idea: TOL ($41.35) Buy Dec – Jan 44 Call Spread for 32 cents
-Sell to open 1 Dec 44 call at 30 cents
-Buy to open 1 Jan 44 call for 62 cents
Break-even on Dec expiration:
This trade performs best with a gradual move towards the 44 strike over the next two weeks into Dec expiration. If the stock is at or below 44 on Dec expiration the short 44 call will expire worthless and the trade will be left naked long the Jan 44 call. If the stock is close to 44 then the Jan 44 call will have appreciated as it will have picked up deltas. At that point, it might make sense to further reduce the premium at risk by selling a higher strike call in Jan turning the trade into a vertical call spread. The max risk f this trade is the 32 cents in premium paid, and would be at risk with a large move below the current level, or well above the 44 strike.