Back on Sept 20th, I laid out a near-term bearish thesis for shares of Amazon.com (AMZN):
Amazon… is up 21% on the year, interestingly a tad less than the Nasdaq composites’ 23% ytd gains, and also sits 11% below its all-time high made last September. The simplest indictment of the stock from a trading standpoint is that since breaking the uptrend that had been in place since late December, the stock has failed to retake it, and has clung to what some might see as support at its 200-day moving average
…
As we think about the quarter and their guidance for the Q4 Holiday season it makes sense to consider what impacted guidance back in July that has put a lid on the stock for the time being.
Earlier in the month, RBC Capital’s top-rated internet analyst Mark Mahaney took a look at the main issue in the last quarter, the effects of one-day prime shipping, as it had a positive impact on “accelerating Revenue & Unit growth” but also “demonstrated accelerating Shipping & Fulfillment costs and headcount growth, with an incremental cost of $800MM+.”
…
in the near term, and especially in front of the holiday season, Q4 guidance might uniquely be impacted by the added headcount and fulfillment costs. The stock’s price action of late is telling that investors are worried about something, especially as the rest of MAGA looks poised to trade back at their highs.
At the time the stock was $1790, not far from where it is trading now at $1775 and I detailed the following trade idea to play for a breakdown:
Look to buy near the money put spreads that catch Q3 earnings in late October and look to spread as the stock works lower.
Bearish Trade Idea: AMZN ($1790) BUY NOV 1760 – 1500 PUT SPREAD FOR $50
-Buy to open 1 Nov 1760 Put for $60
-Sell to open 1 Nov 1500 put at $10
and I detailed the trade idea on CNBC’s Options Action:
Amazon losing steam this week, and @RiskReversal sees more pain ahead for the e-commerce giant. Here’s his take on $AMZN pic.twitter.com/vHpny79hGA
— Options Action (@OptionsAction) September 20, 2019
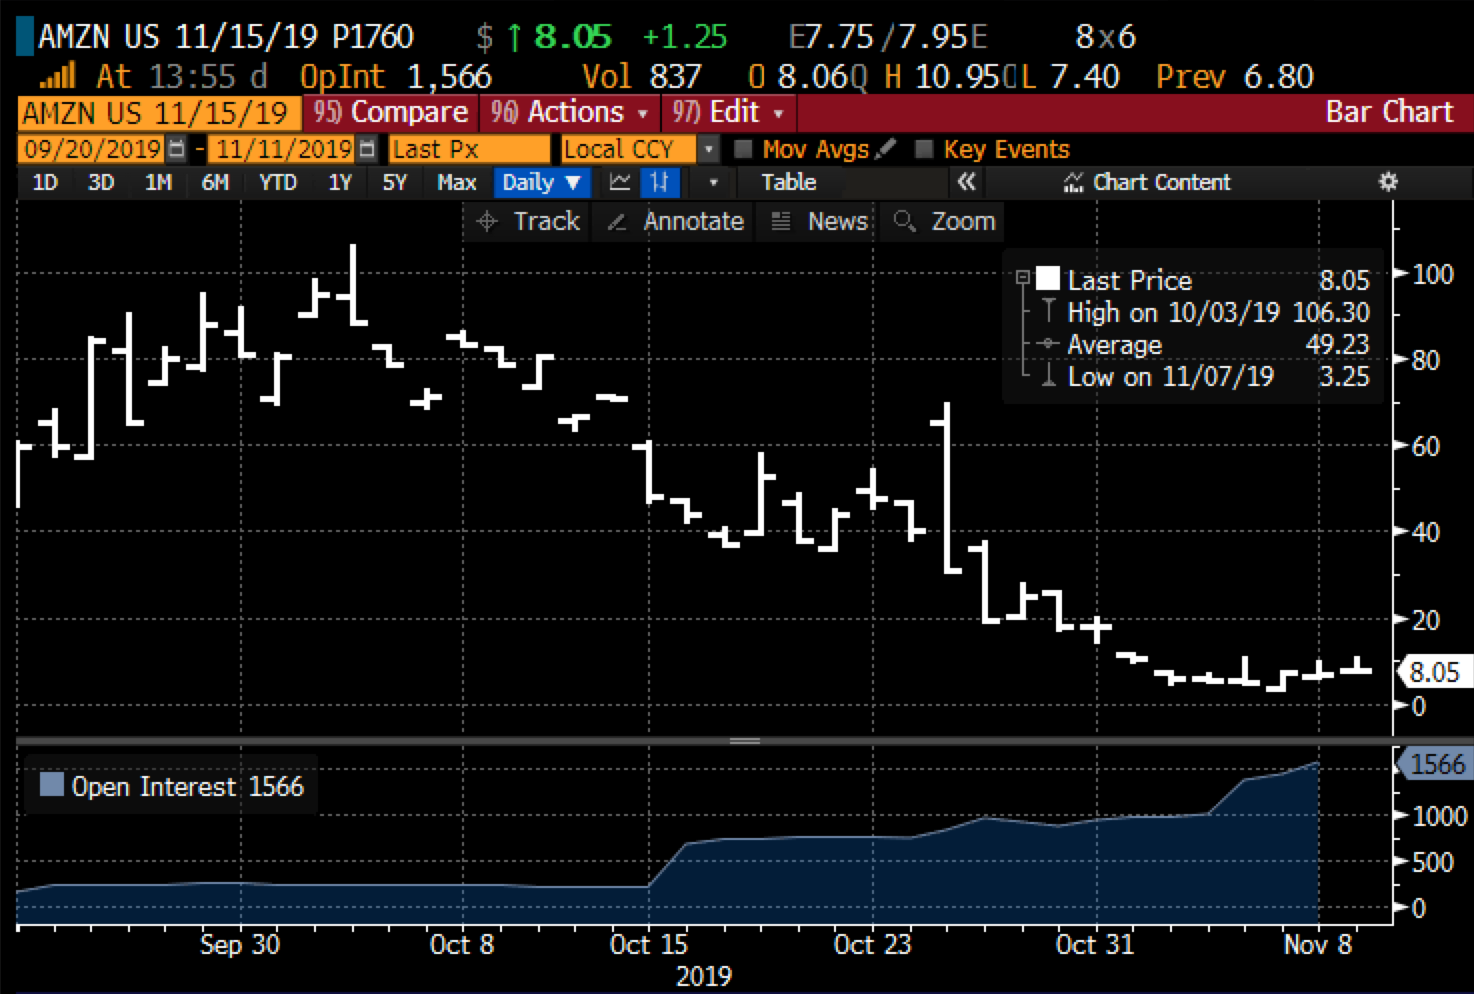
Earnings and guidance did in fact disappoint and the stock initially was trading down close to 8% but bounced back throughout the day after results. This trade was briefly a small winner, but now with days to expiration, the Nov 1760 put can be sold at just $8.
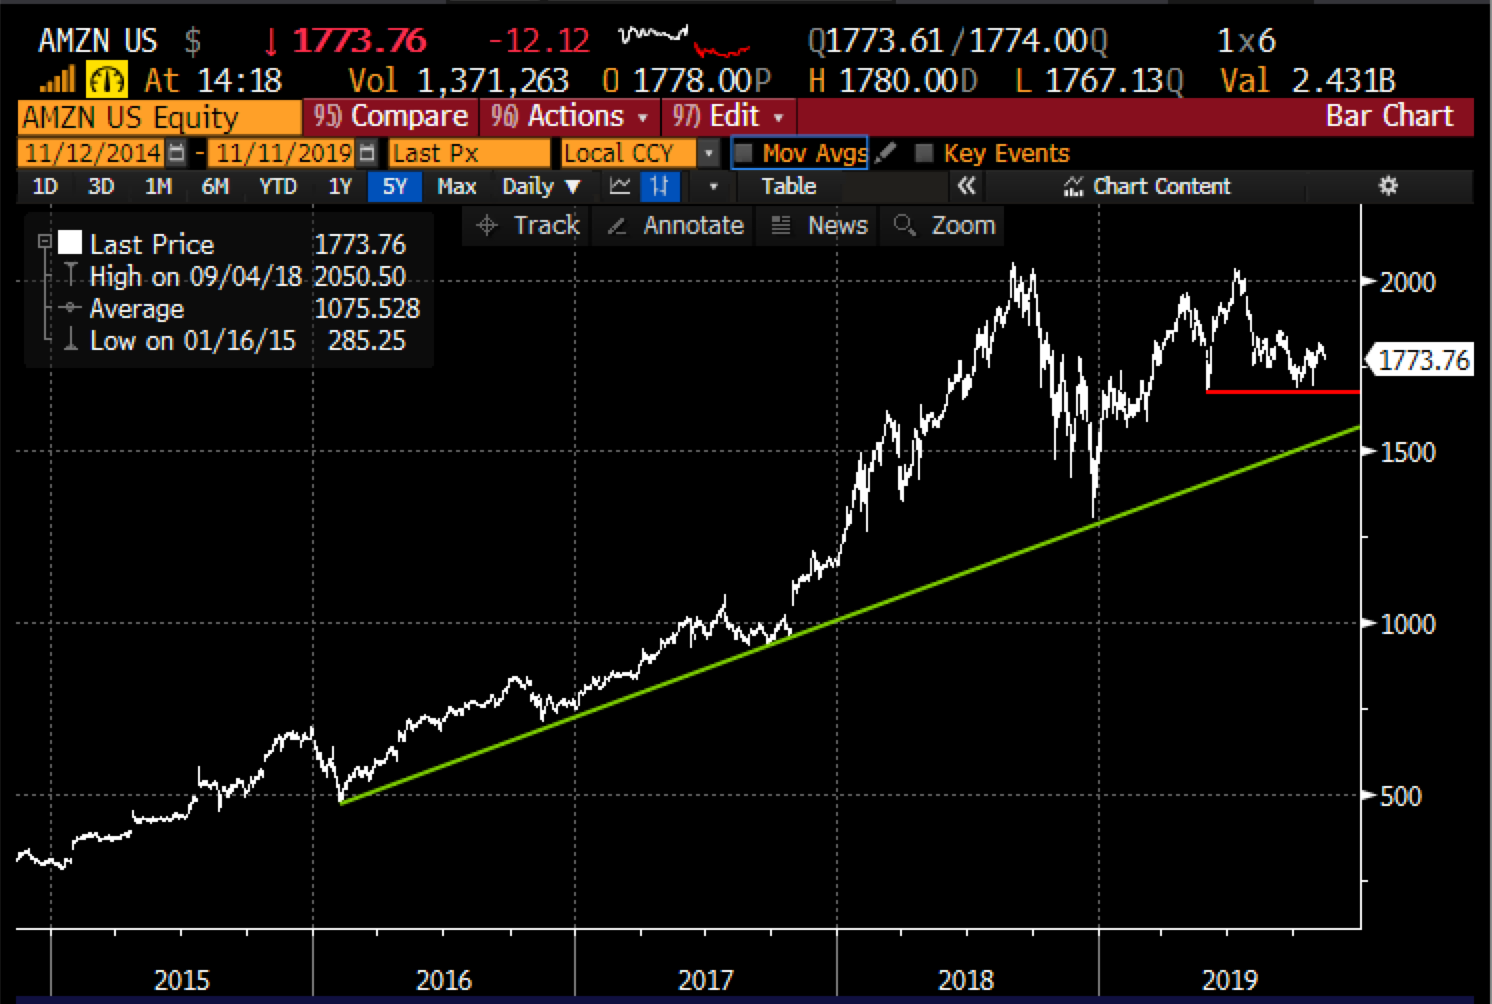
From where I sit, the thesis has not changed much and while the rest of MAGA, MSFT, AAPL, and GOOGL have all made new highs with the S&P 500, AMZN has NOT and frankly $1700 remains key near term support and I suspect that a test of the long term uptrend down about $275 as opposed to a test of the 2018 all-time highs, also up about $275 seems more likely given the massive relative underperformance:
So what’s the trade? If I were considering rolling this bearish view there are a couple of trade ideas I might consider targeting a break of near term support at $1700 but there are a few different ways to get there eyeing Q4 earnings in late Jan to be the next identifiable catalyst:
Put Spread:
Bearish Trade Idea: AMZN ($1775) Buy Feb 1750 – 1500 Put Spread for $60
-Buy to open 1 Feb 1750 put for $71
-Sell to open 1 Feb 1500 put at $11
Break-even on Feb Expiration:
Profits of up to 190 between 1690 and 1500 with max gain of 190 at 1500 or lower.
Losses of up to 60 between 1690 and 1750 with max loss of 60 at 1750 or higher.
Rationale: this trade idea breaks-even down 4.7% in three months, risks only 3.4% of the stock price with the profit potential of up to 11% if the stock is down 15.5% on Feb expiration.
Or
Put Calendar:
If you like the idea of playing for a breakdown but not until the new year, you might consider put calendars, looking to sell near dated out of the money puts to help finance the purchase of longer-dated put of the money puts that might catch a catalyst like earnings… for instance…
Bearish Trade Idea: AMZN ($1775) Buy Dec – Feb 1700 put calendar for $34
-Sell to open 1 Dec 1700 put at $16
-Buy to open 1 Feb 1700 put for $50
Break-even on Feb expiration:
The ideal scenario is that AMZN is near 1700 on Dec expiration and the short 1700 put expires worthless or can be covered for a small amount and you are left long the Feb 1700 put for $34 or about 2% of the stock price.
The max risk of the trade is $34 on a sharp move higher than current levels or a sharp move below the $1700 strike price.
This trade offers a good bit of optionality as it allows to turn again into a calendar by selling a Jan 1700 put or possibly turn into a vertical put spread in Feb by selling a lower strike put in the same expiration that you are long 1700 put.