Today after the close Facebook (FB) will report their Q3 earnings results. The options market is implying about a $12 move in either direction tomorrow, or about 6.5%, which is rich to the 5.5% average one day move following the last four quarters.
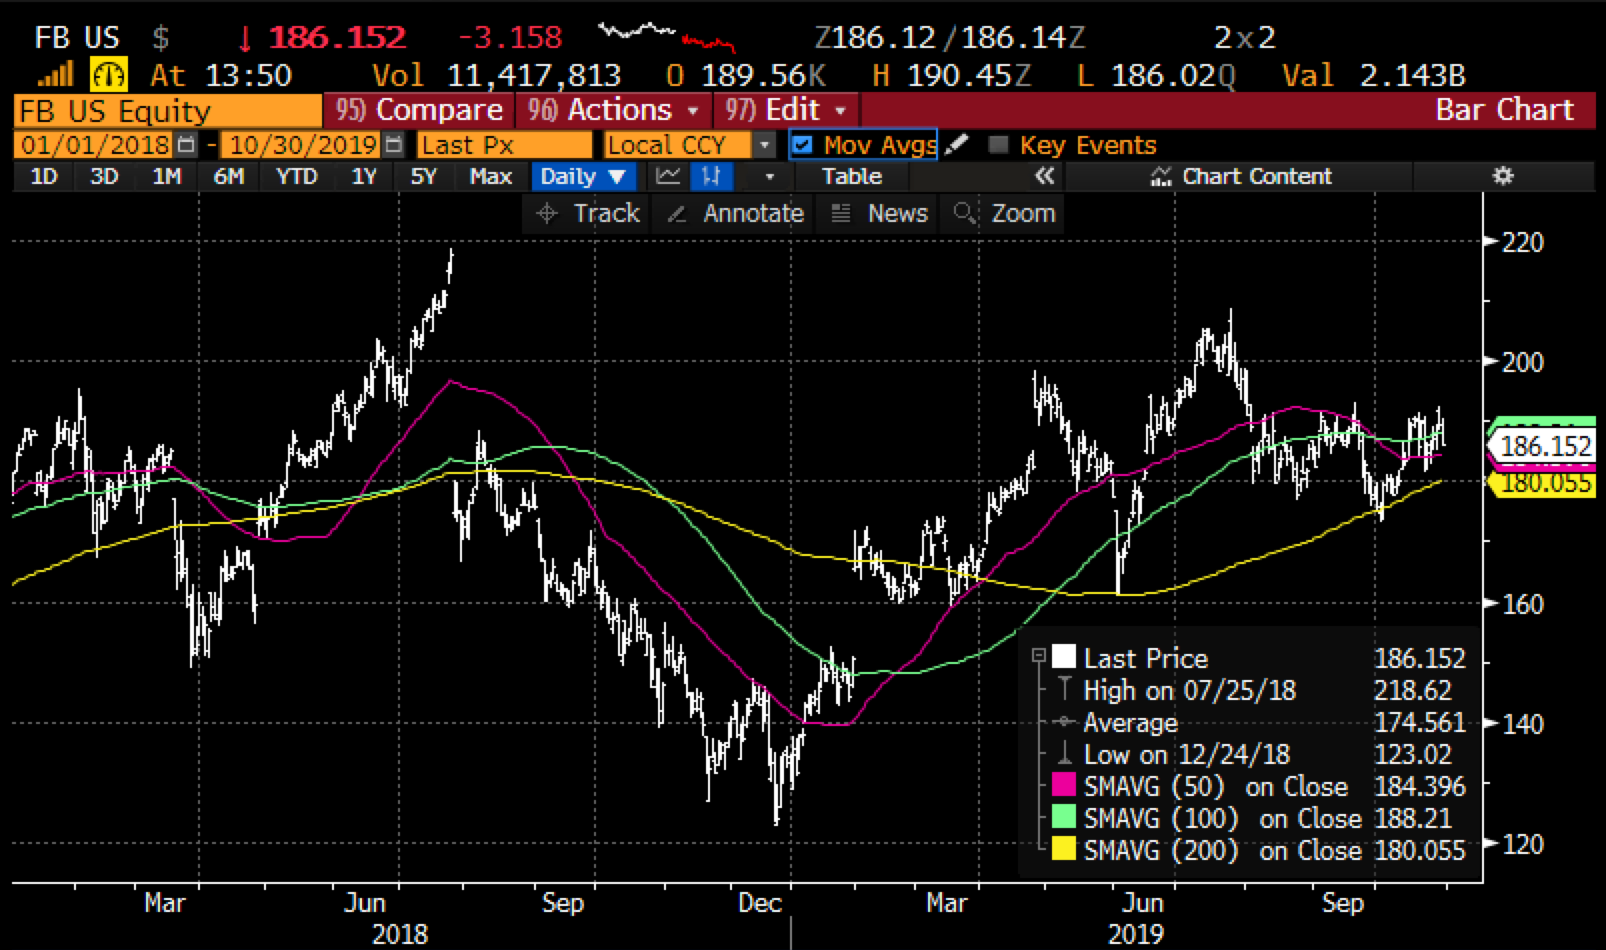
Shares of FB are up 42% on the year, up 51% from its 52-week lows in made in late December, but recently have stalled out a bit, down 10% from its 52-week high made in late July prior to its Q2 report and down 15% from its fairly epic all-time high in July 2018 when it dropped 19%, the largest one day drop of any stock in market cap terms. Near-term the stock has found some support in and around its 50, 100 and 200 day moving averages:
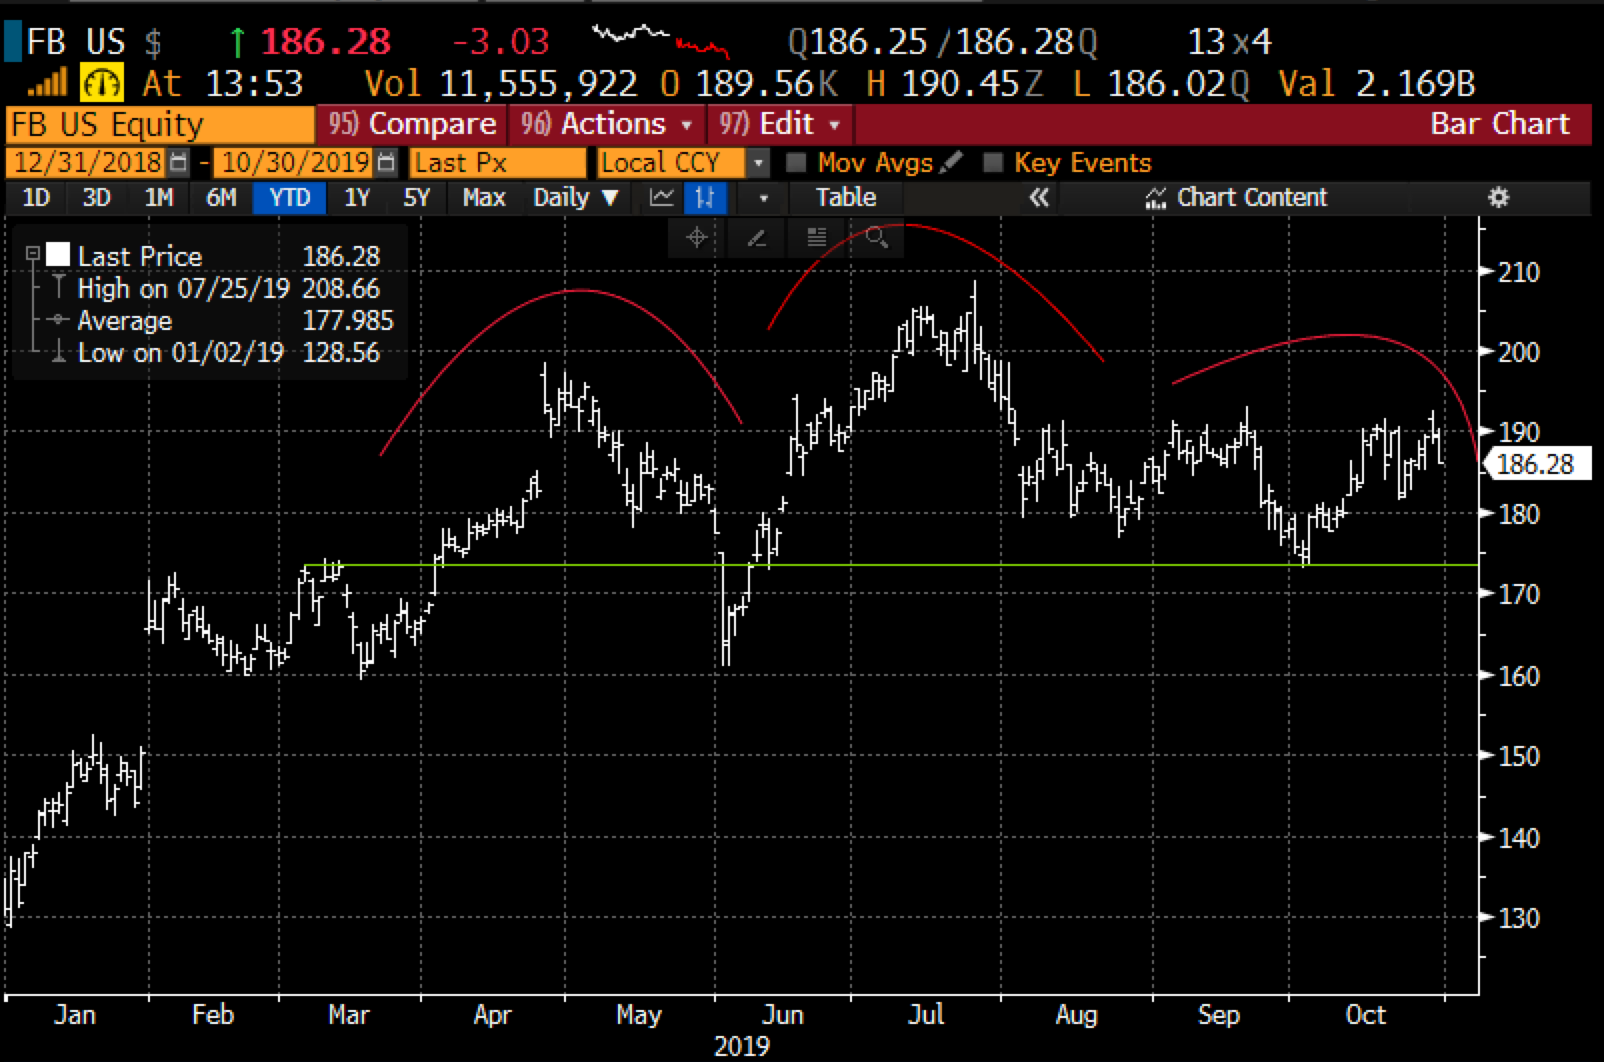
Looking at the year-to-date chart $175 looks to be an important near-term support level, or possibly the neckline of an emerging head and shoulders top pattern:
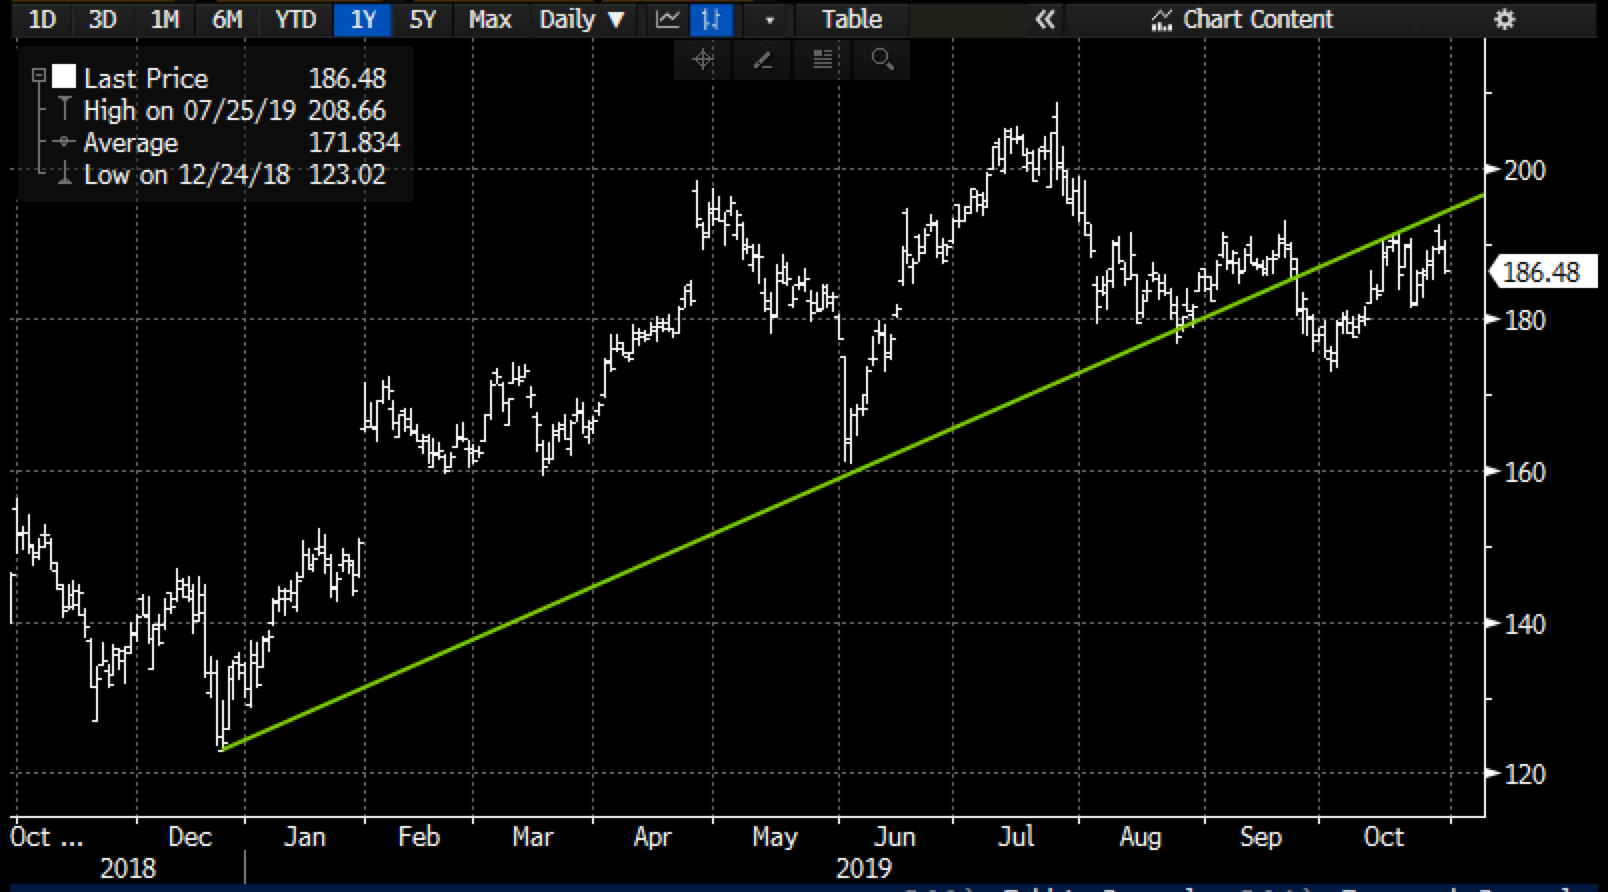
You could also draw an uptrend from the December low, and see the break below it last month and the rejection this month on a couple of occasions at the former support level (which is now technical resistance) as an important level to shoot against on the short side:
Despite what seems to be no shortage of negative headlines for the company, Wall Street analysts remain fairly steadfast in their Bullishness with 47 Buy ratings, 5 holds and only 2 Sells. One reason for that is that despite the year over year deceleration in eps growth from 26% in 2018 to an expected 5% in 2019, sales are still expected to grow 26% yoy in 2019 and 22% in 2020 to a whopping $85 billion, and the stock trades at just 20x next year’s expected eps. Simply put the stock is cheap, especially for a company that has one-third of the world’s population as a monthly active user.
There are a couple of things that might cause investors and analysts to take a pause on the stock, most notably weaker user engagement/growth and continued deceleration in gross margins which peaked at 87.47% in 2016 and are expected to be 80.79% this year. I suspect given Google’s results earlier in the week that the FB results will be fine and it comes down to spending at a time where the company faces significant regulatory scrutiny which includes fines massive fines and pressure to secure user privacy and safeguard the platform into the 2020 election season from bad-actors.
SO what’s the trade?
If I were inclined to play for a sell-off over the next couple months I might consider a re-test of the June lows:
Bearish Trade Idea: FB ($186.25) Buy Dec 180 – 160 put spread for $4.50
-Buy to open 1 Dec 180 put for 5.65
-Sell to open 1 Dec 160 put at $1.25
Break-even on Dec expiration:
Profits of up to 15.50 between 175.50 and 160 with max gain of 15.50 at 160 or lower.
Losses of up to 5.50 between 175.50 and 180 with max loss of 4.50 at 180 or higher
Rationale: this trade idea risks 2.5% of the stock price to make up to possibly 8.3% if the stock is down 14% by December 20th expiration.
Or
If I were inclined to play for a bounce I might target the $200 level near term a level that appears to be overhead resistance:
Bullish Trade Idea: FB ($186.25) Buy Nov 15th 190 – 200 call spread for $3
-Buy to open 1 Nov 15th 190 call for $5
-Sell to open 1 Nov 15th 200 call at $2
Break-even on Nov 15th expiration:
Profits of up to 7 between 193 and 200 with max gain of 7 above 200
Losses of up to 3 between 190 and 193 with max loss of 3 at or below 190
Rationale: this trade idea risks 1.6% of the stock price, for a break-even up 3.2% well within the implied move with a max gain up 7% in two weeks from the current trading level.