Microsoft (MSFT) will report its fiscal Q1 results tonight after the close. The options market is implying nearly a 4% move tomorrow in either direction, which is rich to the average over the last four-quarters of nearly 3% but below the ten-year average one-day post-earnings move of 4%. With the stock near $136 the Oct 25th weekly 136 straddle (the call premium + the put premium) is offered at $5.30, if you bought that and thus the implied earnings movement you would need a rally above $141.30, or a decline below $130.70 to make money “buying the move”.
Shares of MSFT are up a whopping 34% on the year massively outperforming the S&P 500’s 19.7% ytd gains, and the Nasdaq Composite 22% ytd gains. When the company last reported results in July it was trading at nearly the same price, and since then the stock has been range-bound in the low to mid $130s with a brief new all-time high made a month ago before the stock’s recent pullback:
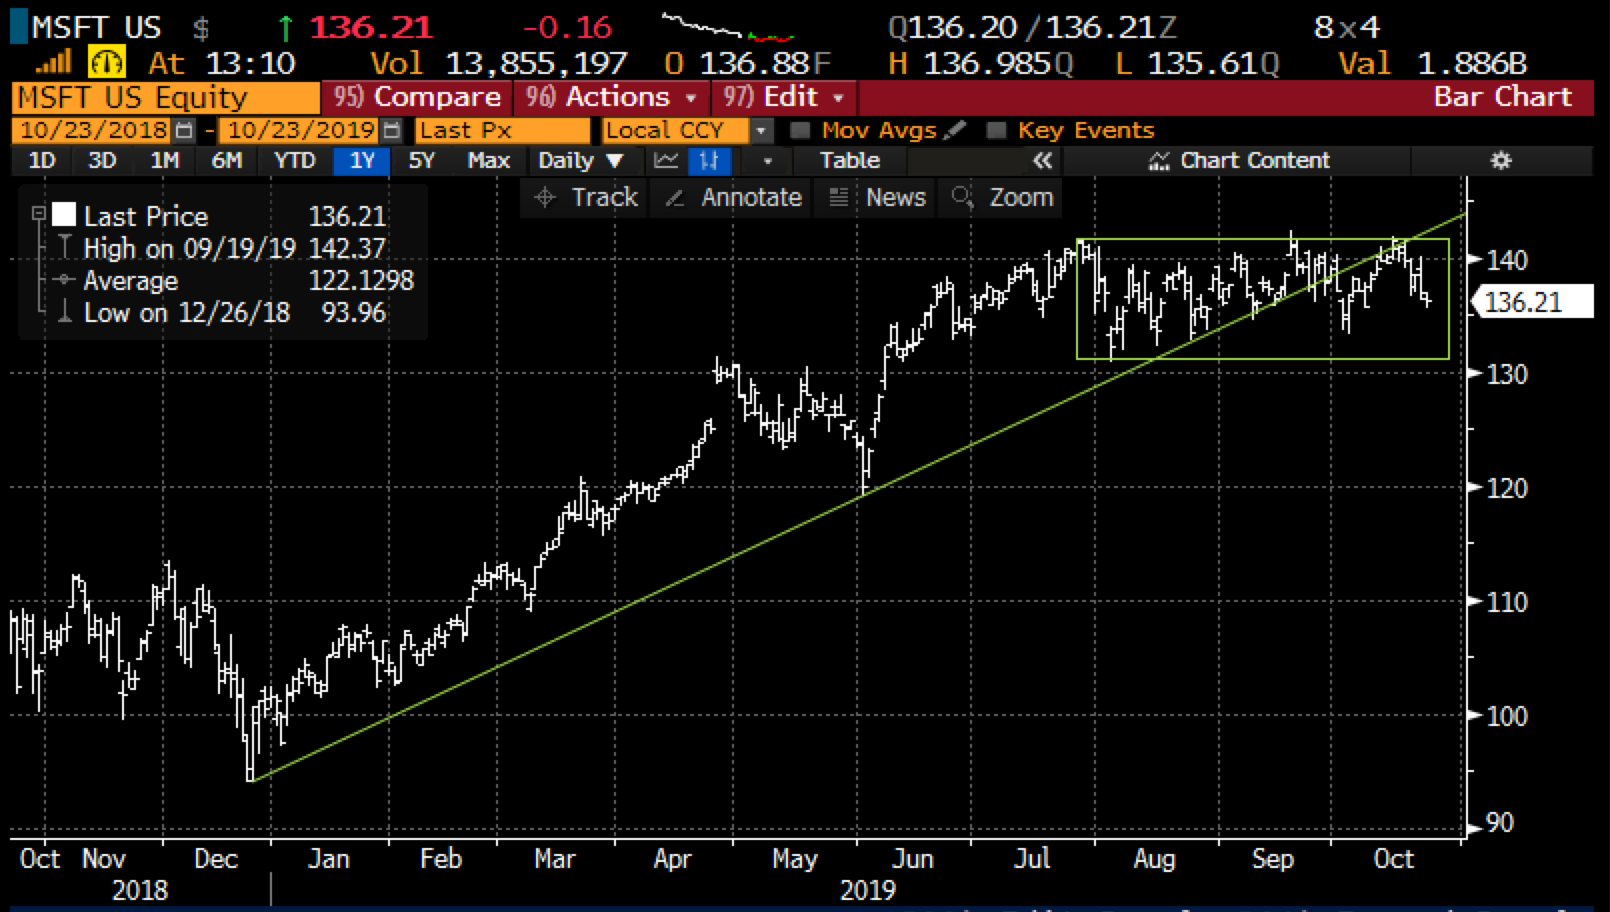
It is also worth noting that the recent consolidation has placed the stock below the uptrend that has been in place since the Dec lows when the stock briefly traded below $100. With the stock below its 50 and 100 day moving averages, but still above its 200 day neat $127, it is reasonable to assume that the stock has lost a good bit of the momentum that propelled it to numerous new all-time highs from March to July.
One reason for this could be the notable sell-off in high growth, high valuation software that my friend Jared Weisfeld, Tech Specialist extraordinaire from Jeffries, discussed last night on Fast Money:
Wall Street analysts are universally bullish on MSFT with 35 buy ratings 2 Holds and No Sells
Here were some comments from Jared on the set up into tonight’s print:
Expectations are needless to say quite high into tonight with MSFT as one of the best performing software stocks throughout this tumultuous period (was one of the only names to be green in the month of September). With that said, while expectations are high, I haven’t heard unreasonable numbers from the buy-side. From a PC perspective, datapoints remain robust with IDC/Gartner both citing low single-digit y/y growth in the September quarter (although some worries this is due to pull-in ahead of tariffs, consistent with takeaways from my recent Asia trip) – and this is in the context of sub-seasonal consensus estimates for MPC. On the closely watched Azure metric, Azure grew at 68% constant currency in the June quarter and the set-up is actually favorable as the constant currency year-ago comp in the September quarter at +76% y/y eases by ~900bps. I don’t get the sense that expectations are out of control here and a mid-60% growth rate on Azure in the Sept. Q should be sufficient for the stock.
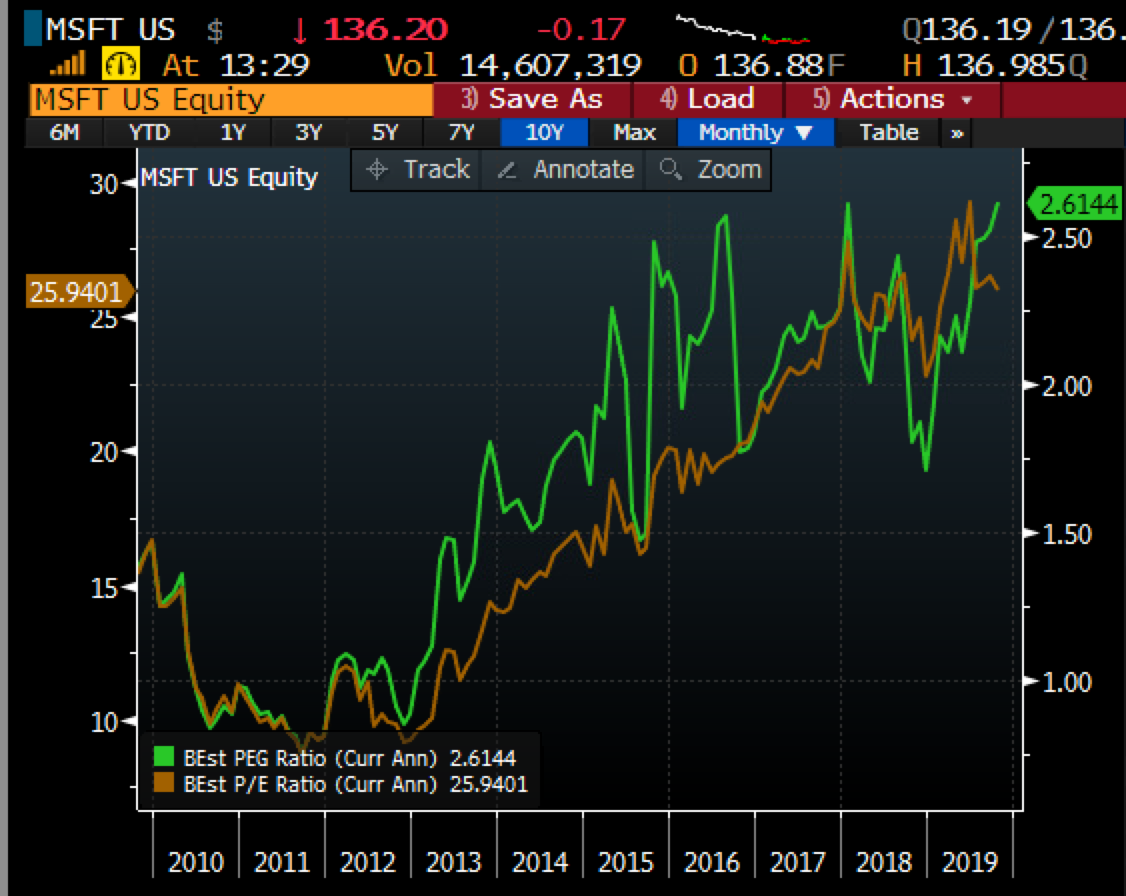
You know what else is high aside from expectations? MSFT’s valuation trading about 26x expected FY 2020 eps growth of 11% on an expected 11% bump in sales. Make no mistake, that is phenomenal expected growth for a company expected to do close to $150 billion in sales, but its worth noting that its PE to Growth (PE/G) is nearing 2.5 which is easily a cycle high::
So what’s the trade? expectations are high and given the backdrop of weakening price action in many of MSFT’s large-cap software peers, and the fact that it seems that there are no shortage of investors hiding out in MSFT, the stock seems crowded to me. After Texas Instruments (TXN) horrid guidance last night, if a bell-weather in software were to guide down it could be lights out for tech stocks for a bit, especially when you consider that many software bames are already correcting.
If I were long stock and not interested in selling I might consider a collar, a hedging strategy that allows me to hang onto my stock, participate in upside to a point but also define my risk to a price, by selling an out of the money call and using the proceeds to help finance the purchase of an out of the money put, for instance…
vs 100 shares of MSFT long at $136 Buy Nov 142 – 130 collar for zero cost
-Sell to open 1 Nov 142 call at $1.50
-Buy to open 1 Nov 130 put for $1.50
Break-even on Nov expiration:
Gains of the stock up till $142, stock called away at $142 or higher, but the investor could always cover the short call for a loss to keep the long position intact.
Losses of the stock down to 130, but protected below
Rationale: this overlay allows for the potential of $6 in gains between now and Nov expiration and only up to $6 in losses between now and November expiration. An investor would hedge with a collar if there ere more worried about extreme near-term downside as opposed to the prospect of extreme near-term upside. The choice of strikes generally lines up with the implied earnings move.
If I were looking to play directionally for a breakout I might consider buying the Dec 140 – 150 call spread for $2.50 vs stock at $136, buying 1 Dec 140 calls for $3.25, selling 1 Dec 150 call at 75 cents, this trade breaks even up at $142.50, very near last month’s all-time high and allows for gains of up to $7.50 between $142.50 and $150 with the max gain above $150. This trade breaks-even up nearly 5%, allows for gains of up to 5.5% of the stock price if the stock is up 10% on Dec expiration.
Or If I were inclined to play for a miss and guide down I might consider a put spread in Nov, maybe the Nov 135 – 125 put spread for $2.50, vs stock at )$136 buying 1 of the Nov 135 puts for $3.55 and selling one of the Nov 125 puts at 55 cents. This trade breaks even down at $132.50 and makes up to 7.50 between $132.50 and $125 with max loss below. This trade has a break-even down nearly 2.6% in less than a month and allows for gains of up 5.5% of the stock price if the stock is down 8 on Nov expiration.