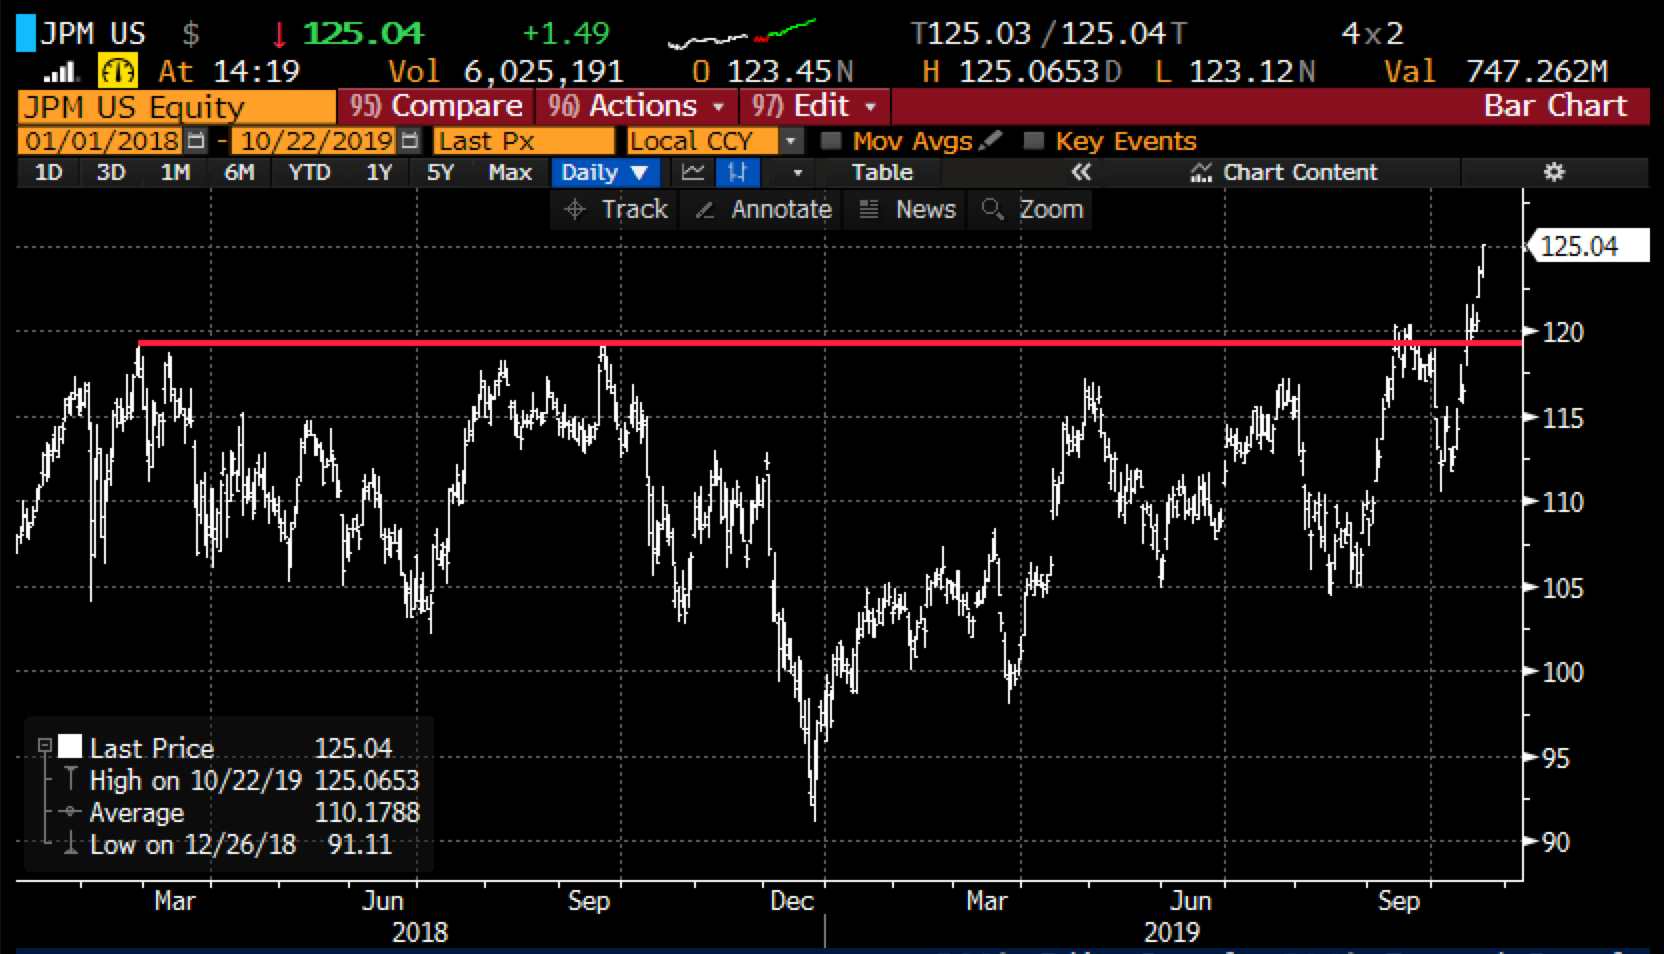
Last Monday in my post detailing how to play J.P. Morgan (JPM) for a breakout to new all-time highs following Q3 earnings, I had the following to say about the power of the chart pattern using Nike (NKE) as an example the prior month:

Well JPM did follow suit, making a new all-time high and now past technical resistance should serve as support:
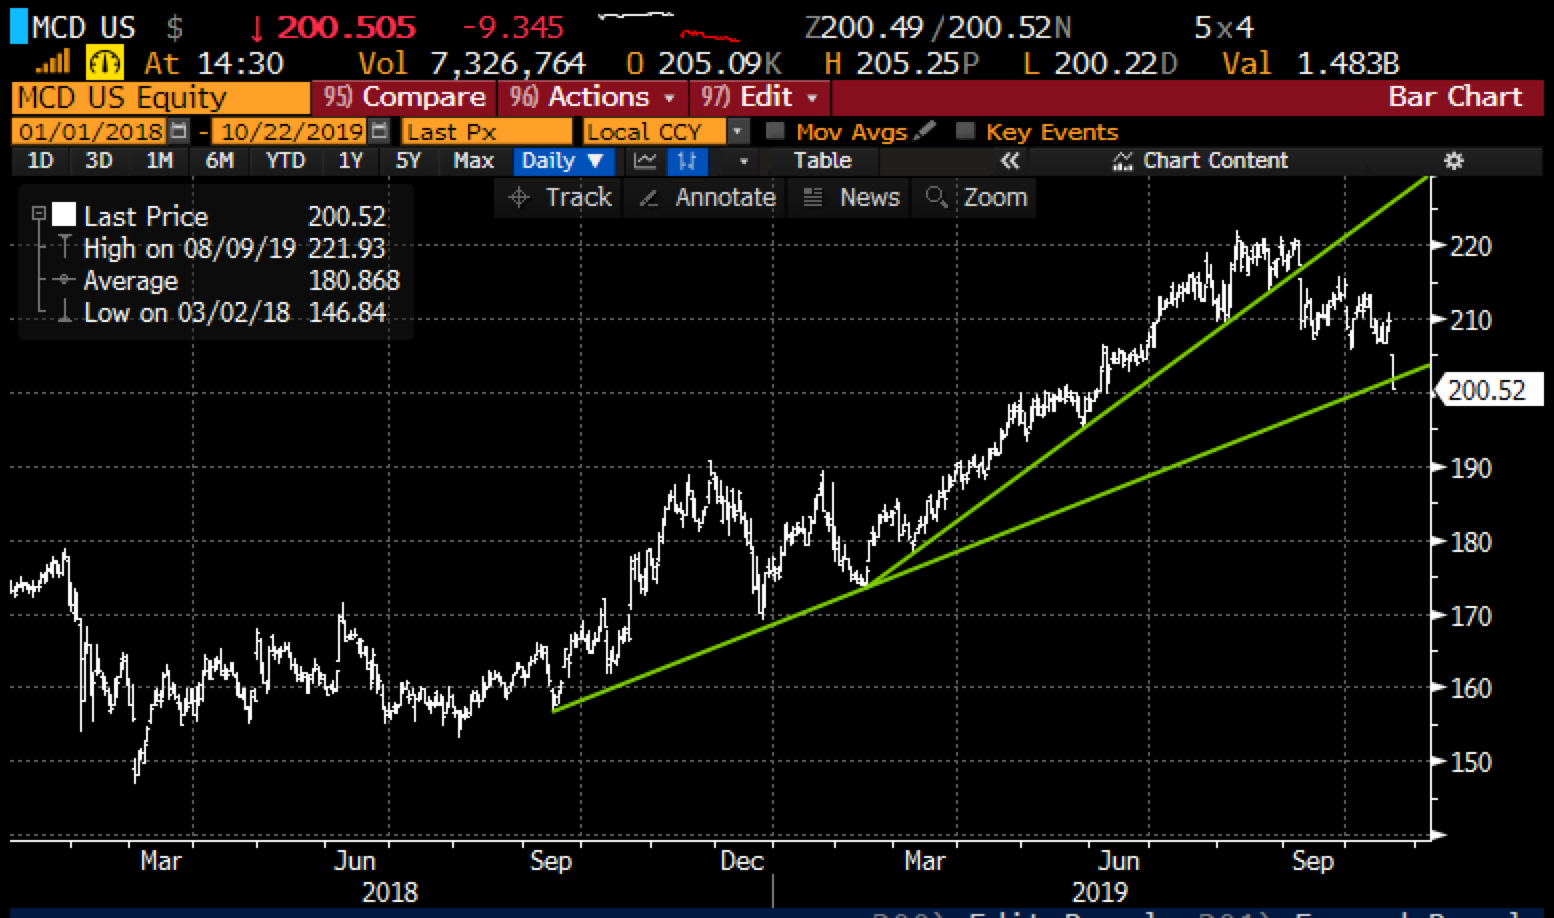
It is worth noting that there is a flipside to these stocks that have been in long bases that have broken out, and it is some prior market leaders that have broken down below important support, in the examples I am going to give that would be the uptrend that has been in many stocks from the Dec 2018 lows. Lets first look at McDonald’s (MCD) trading down more than 4% after reporting disappointing North American same-store sales. At its highs, this summer shares of MCD were up 25% besting the performance of the S&P 500 (SPX) but is now underperforming up less than 13%, but I guess most importantly trading below two important support levels, the first being the steep one from the Feb lows that it broke in Sept and now the one that was in place from the Sept 2018 lows:
It is worth noting that quick-serve restaurant peer Starbucks (SBUX) has been in a similar pattern since its all-time highs made this summer after their Q2 results, with the stock below the uptrend that has been in place since the Dec 2018 lows, and now approaching the uptrend from the June 2018 lows:
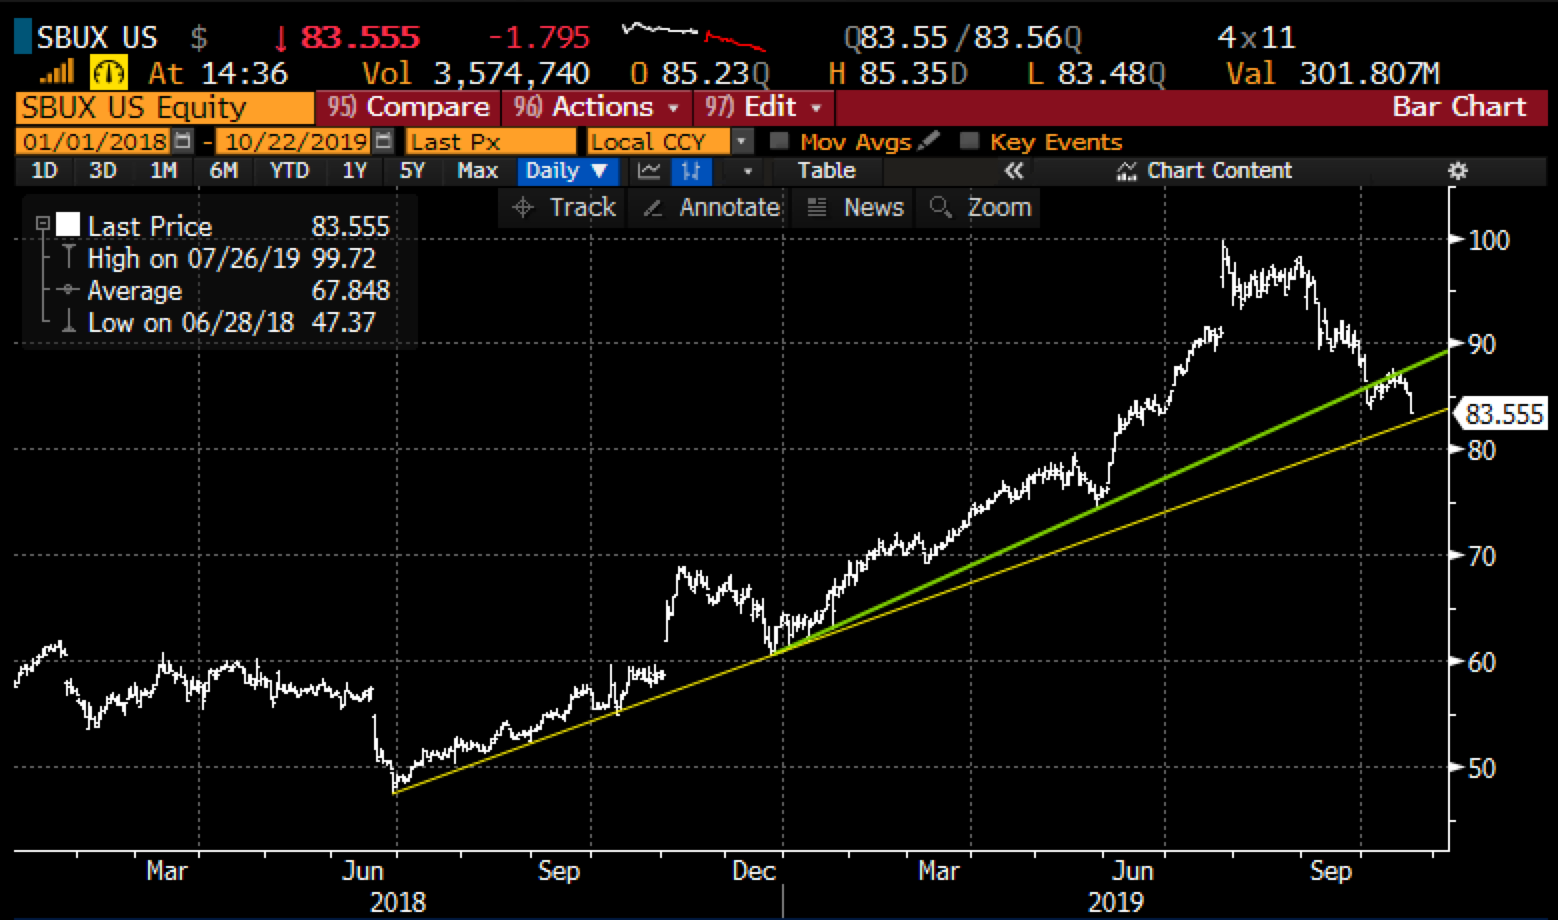
SBUX will report its FQ4 results on Oct 30th after the close. The options market is implying about a 5% one day move, which is a tad shy of the 5.75% one-day average move after the last four earnings reports.
It is not just restaurants, big tech has a few that have similar patterns. Amazon (AMZN) has been in a funk for a few months since breaking below its uptrend that had been in place from the Dec 2018 lows back in early August:
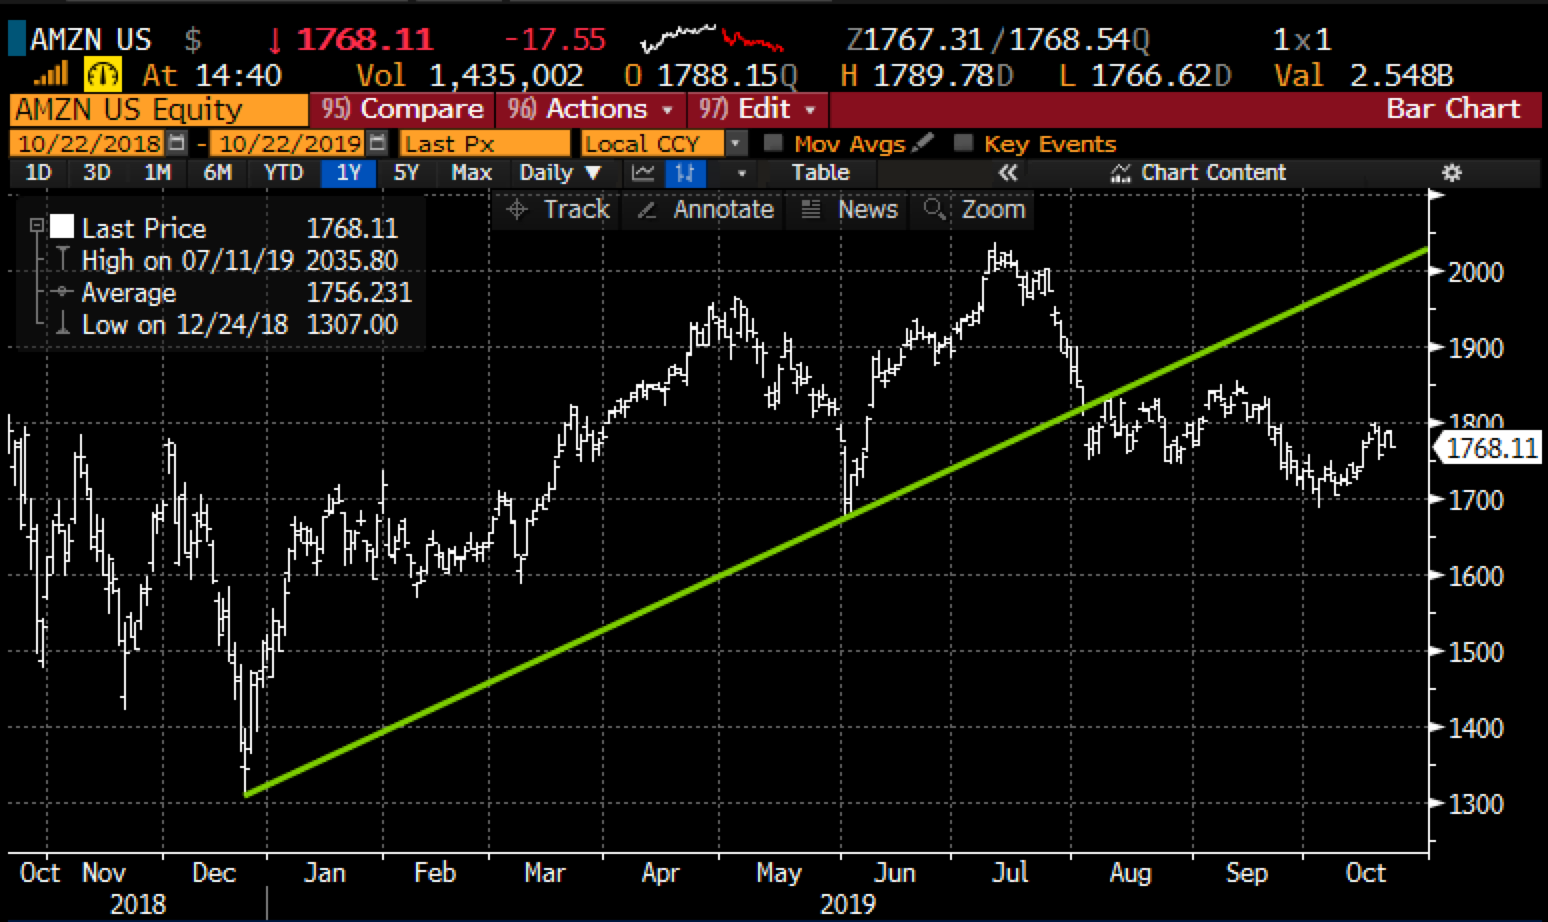
AMZN reports Q3 results Thursday after the close, the options market is implying about a $70 move in either direction or about 4% which is a tad shy of the 4.3% average one day move over the last four quarters.
And then there is Facebook (FB) which is also below its uptrend from its Dec lows:
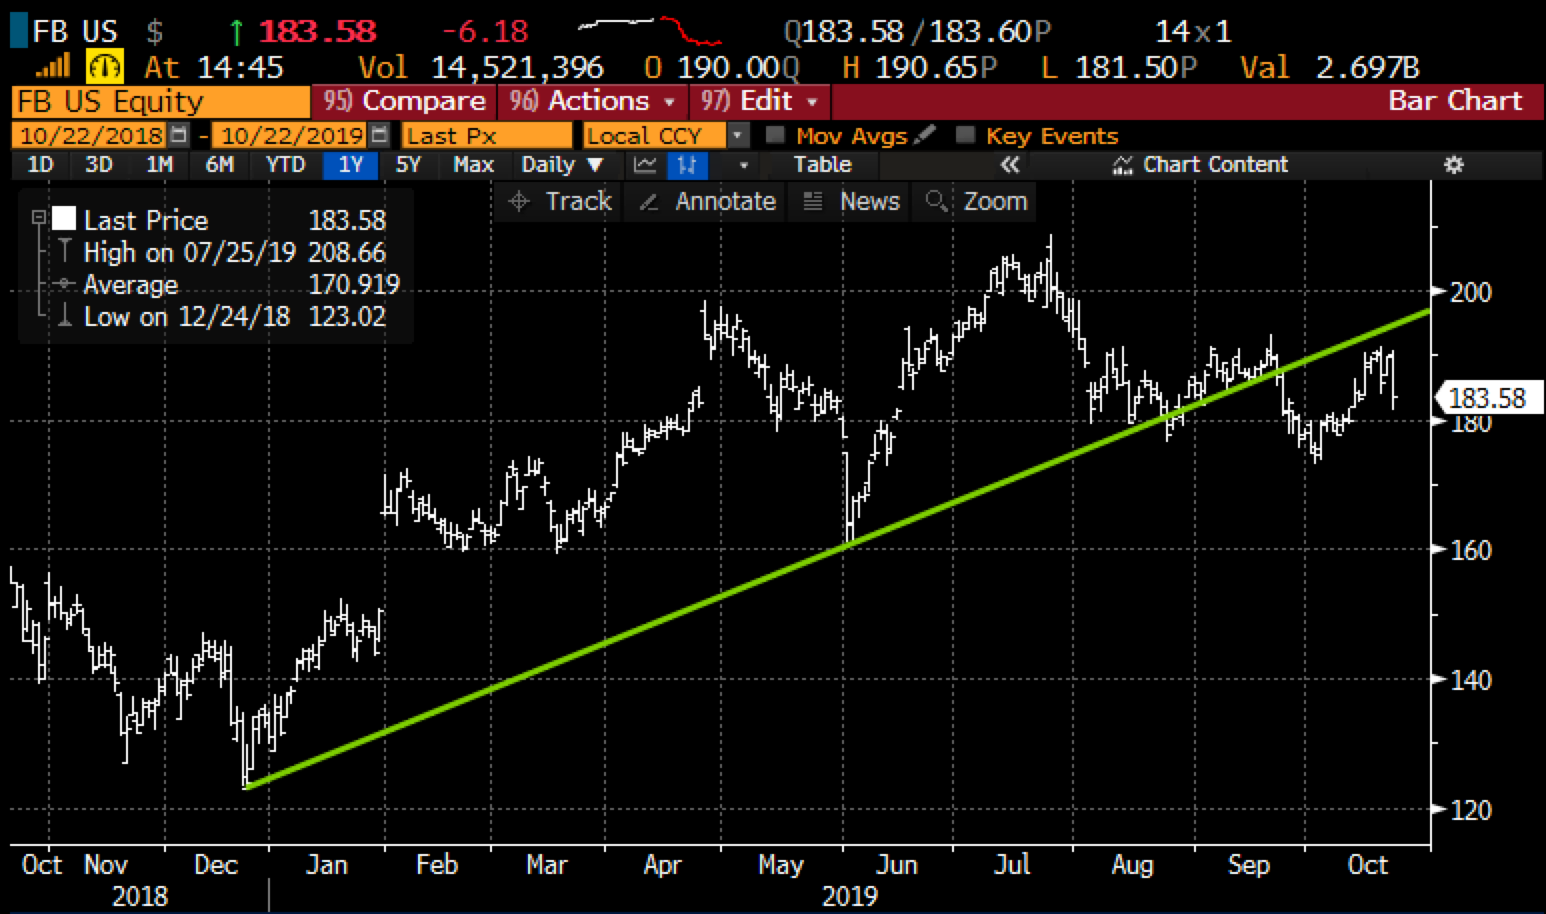
Facebook (FB) will report Q3 results on Oct 30th after the close and the options market is implying about a 6.5% one-day post-earnings move which is slightly rich to the four-quarter average one-day post-earnings move of 5.5%.
I guess the take-away here is simple, you can track new highs on the major indices, this will give you a good sense of breadth in the market, but it also makes sense to track how prior market leaders are keeping up with the broad market even if they are passing the baton to other stocks/groups as a form of rotation.
I’ll be sure to circle back and preview SBUX, AMZN, and FB prior to results.