Last week Costco (COST) reported fiscal Q4 results that were essentially in line with expectations, but the stock’s initial response was muted as it was up 42% on the year into the print, and trading at a very rich historical multiple, per WSJ:
Comparable sales, or those from Costco stores open for more than a year as well as online sales, increased 5% in the quarter that ended Sept. 1. Online sales increased 22% in the period.
Profit during the quarter rose to almost $1.10 billion, or $2.47 a share, from $1.04 billion, or $2.36 a share a year earlier. That includes a $123 million charge related to taxes.
Costco said it generated about $47.5 billion in net sales and membership fees in its fiscal fourth quarter, up from $44.41 billion a year earlier.
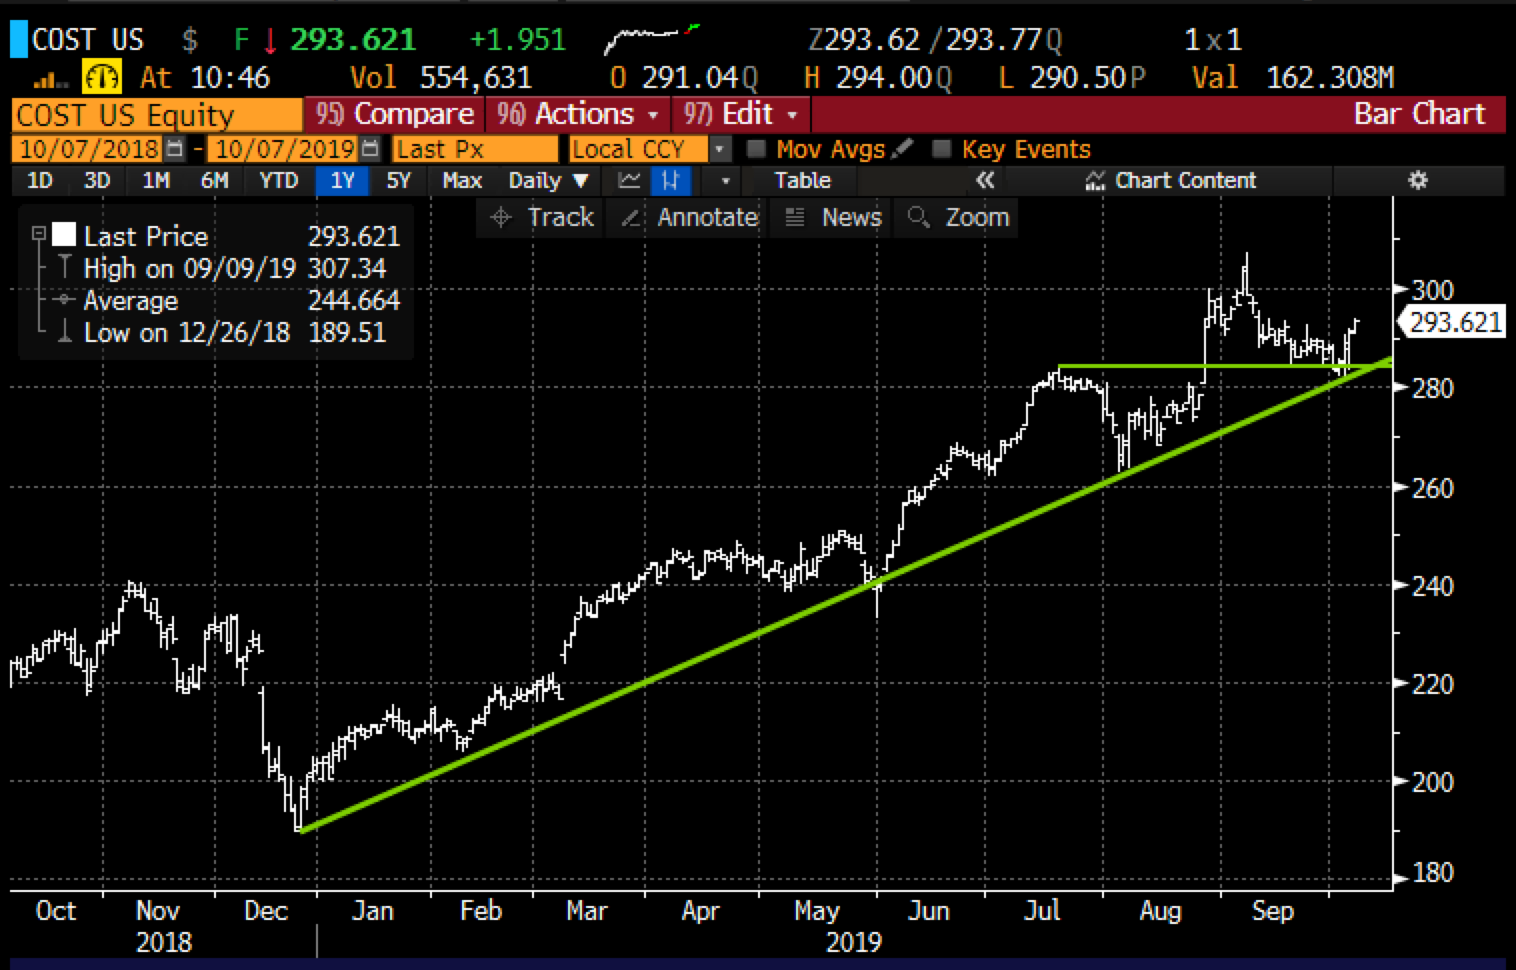
Shares of COST found support last week at the intersection of the uptrend that has been in place since its December lows and the breakout level to new highs from back in August when the stock went bezerk on the excitement associated with the opening of its first store in China:
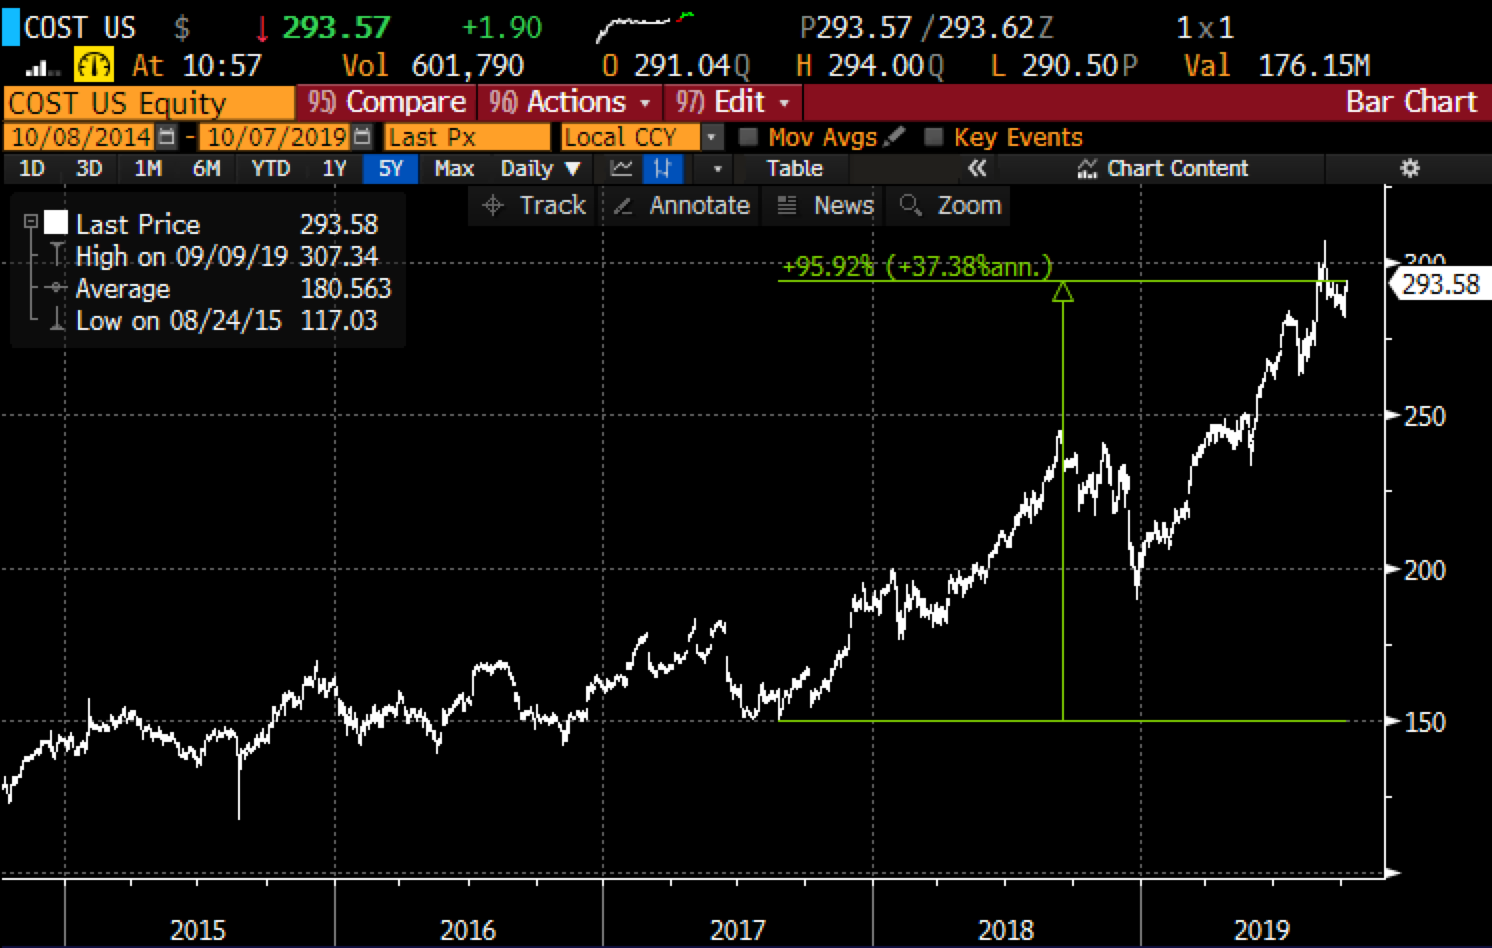
The stock has been an absolute rocketship over the last few years, up nearly 100% from its 2017 low, and up 55% from it’s December low:
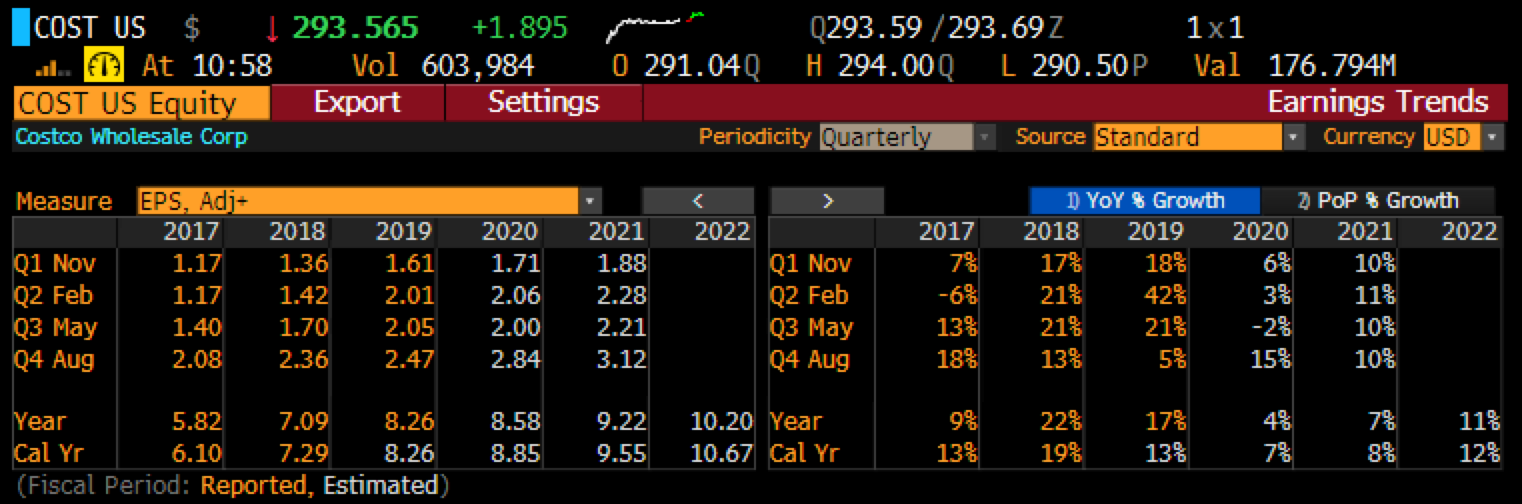
It is worth noting that this price surge has happened as eps and sales growth have decelerated a bit, with eps growth expected to be high single digits this year and next down from double-digit growth the last couple of years:
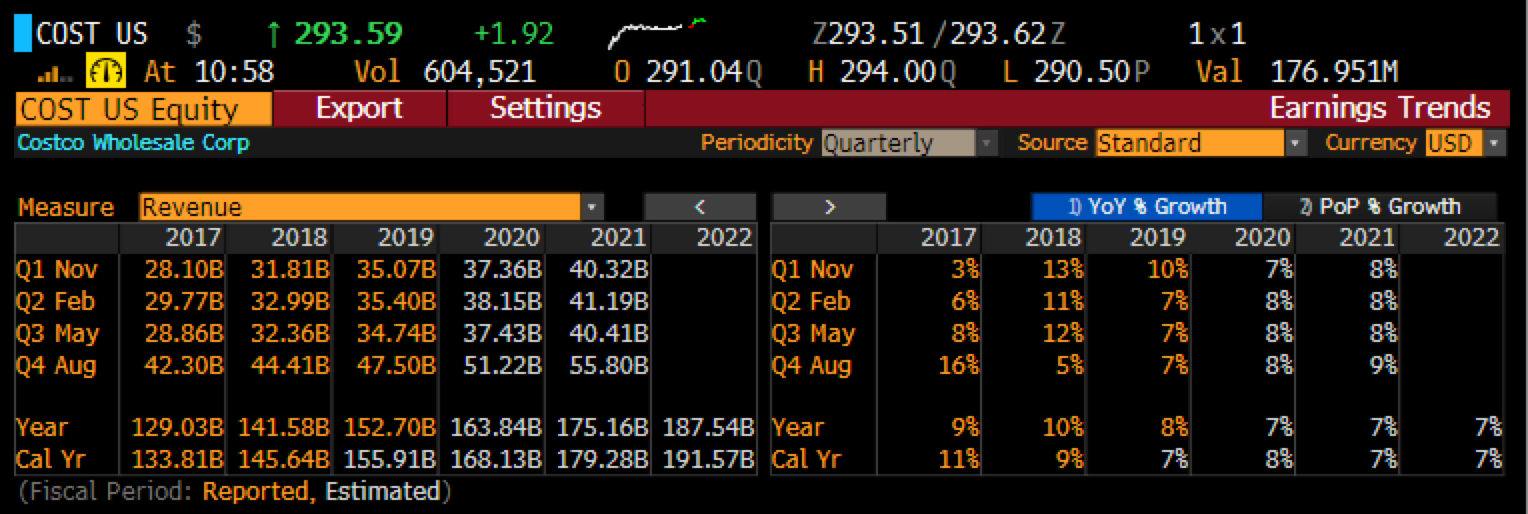
While sales are expected to grow 7% a year for the next few years:
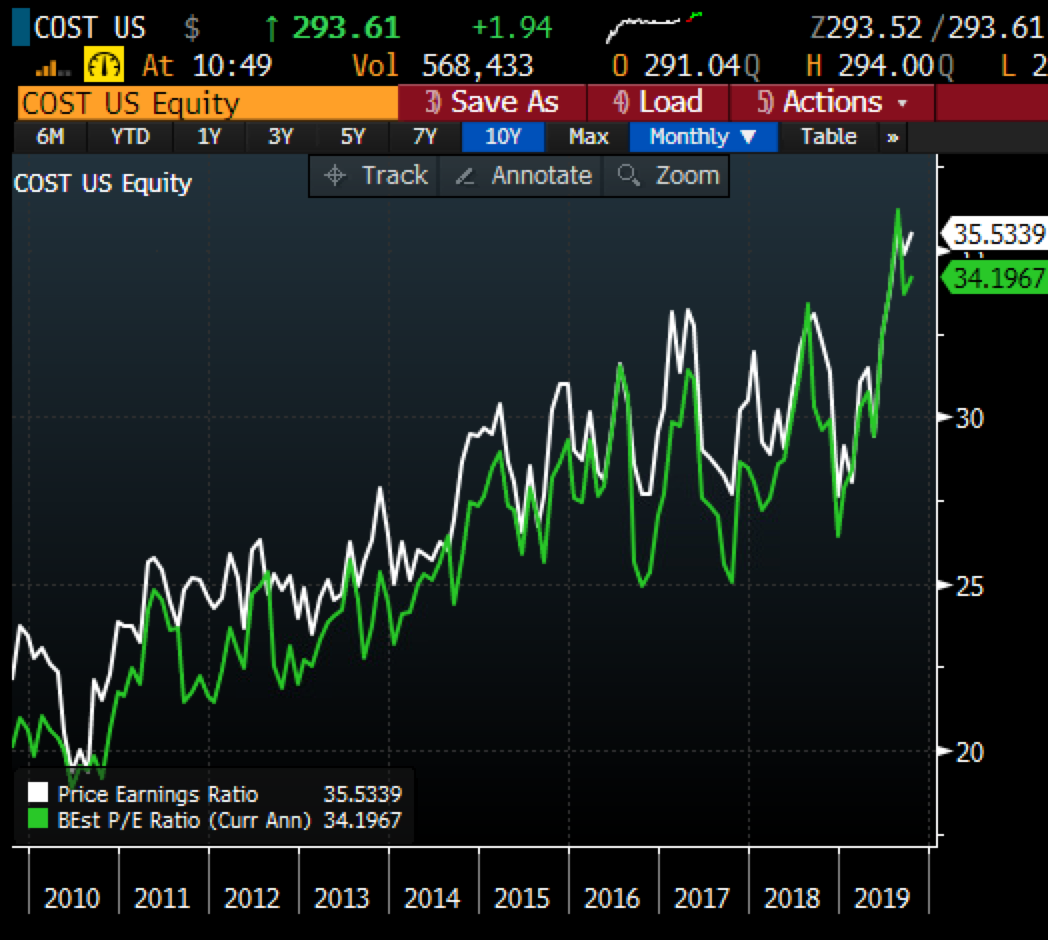
So with the stock’s rise far outstripping eps growth, the stock’s P/E multiple is reaching levels never seen before with the current time at 34x, vs Walmart (WMT) at 24x expected f2020 eps growth of 3% and Target (TGT) at 17.5x expected f2020 eps growth of 4%:
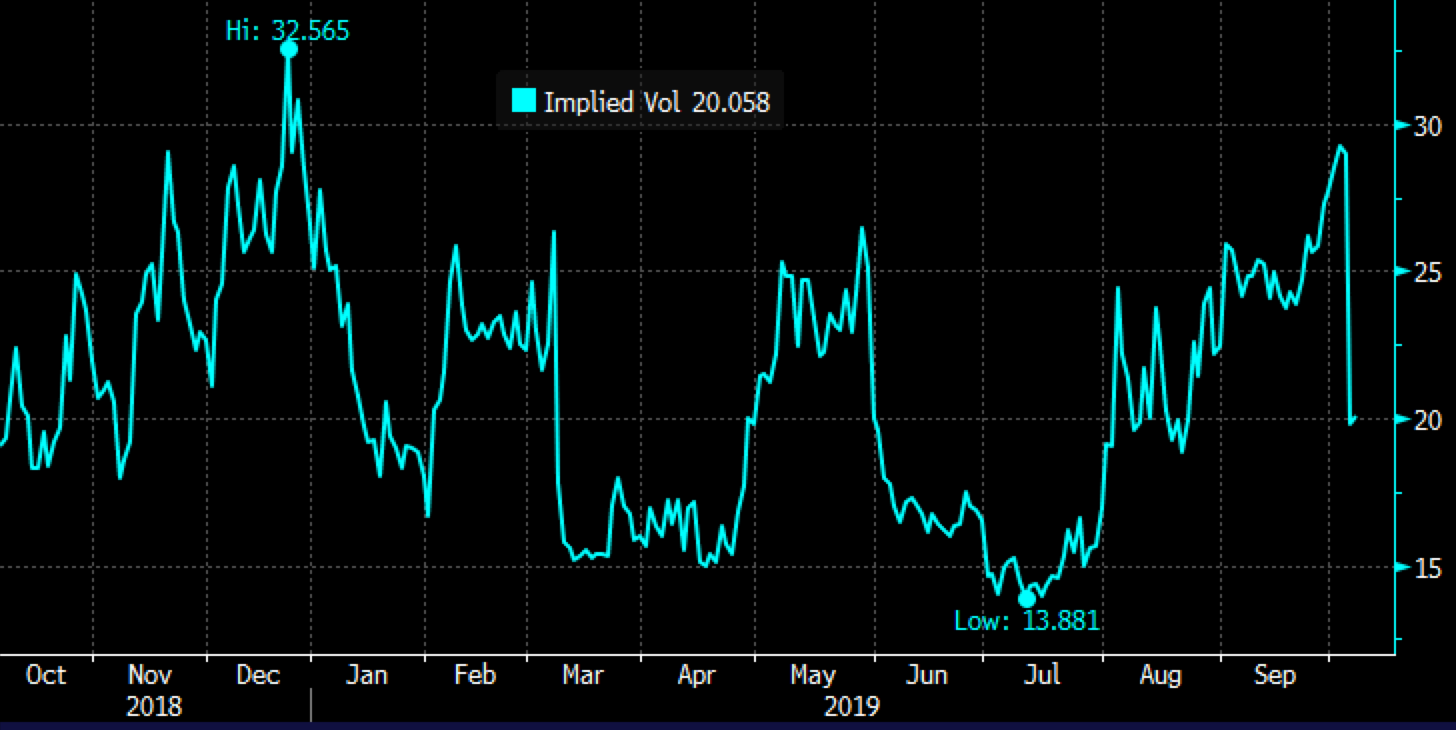
This is the sort of stock that if you own it makes sense to keep raising your downside stop. If you are a trader and have not been involved to the upside, but think that sentiment and valuation are rich and a technical break of the recent support near $285 could yield much lower lows. Short-dated options prices in COST are still fairly elevated, despite coming in hard since their report with 30-day at the money implied volatility at 20%, implying low single-digit daily movement:
The next identifiable catalyst for stock’s like COST, in my opinion, has little do with the company itself and that is the weak economic data we have seen of late, weak consumer sentiment, and the looming threat of additional tariffs hitting U.S. consumers on December 15th, the very week that COST will report their next quarterly results.
So what’s the trade?
If I were inclined to make a bearish bet in COST I might look to December (not listed yet) or January and target a break-down below support:
Bearish Trade Idea: COST ($292.75) Buy Jan 285 – 245 put spread for $8
-Buy to open 1 Jan 285 put for $10.25
-Sell to open 1 Jan 245 put at $2.25
Break-even on Jan expiration:
Profits of up to 32 between 277 and 245 with max gain of 32 at 245 or lower
Losses of up to 8 between 277 and 285 with max loss of 8 above 285
Rationale: this trade risks less than 3% of the stock price for a break-even down 5.4% with a max potential gain of 11% of the stock price if down 16% from the current stock price in the next 3 months,