Tomorrow after the close Micron (MU) will report their fiscal Q4 results. The options market is implying about anm 8% one-day move which is essentially in-line with the average move over the last four earnings reports.
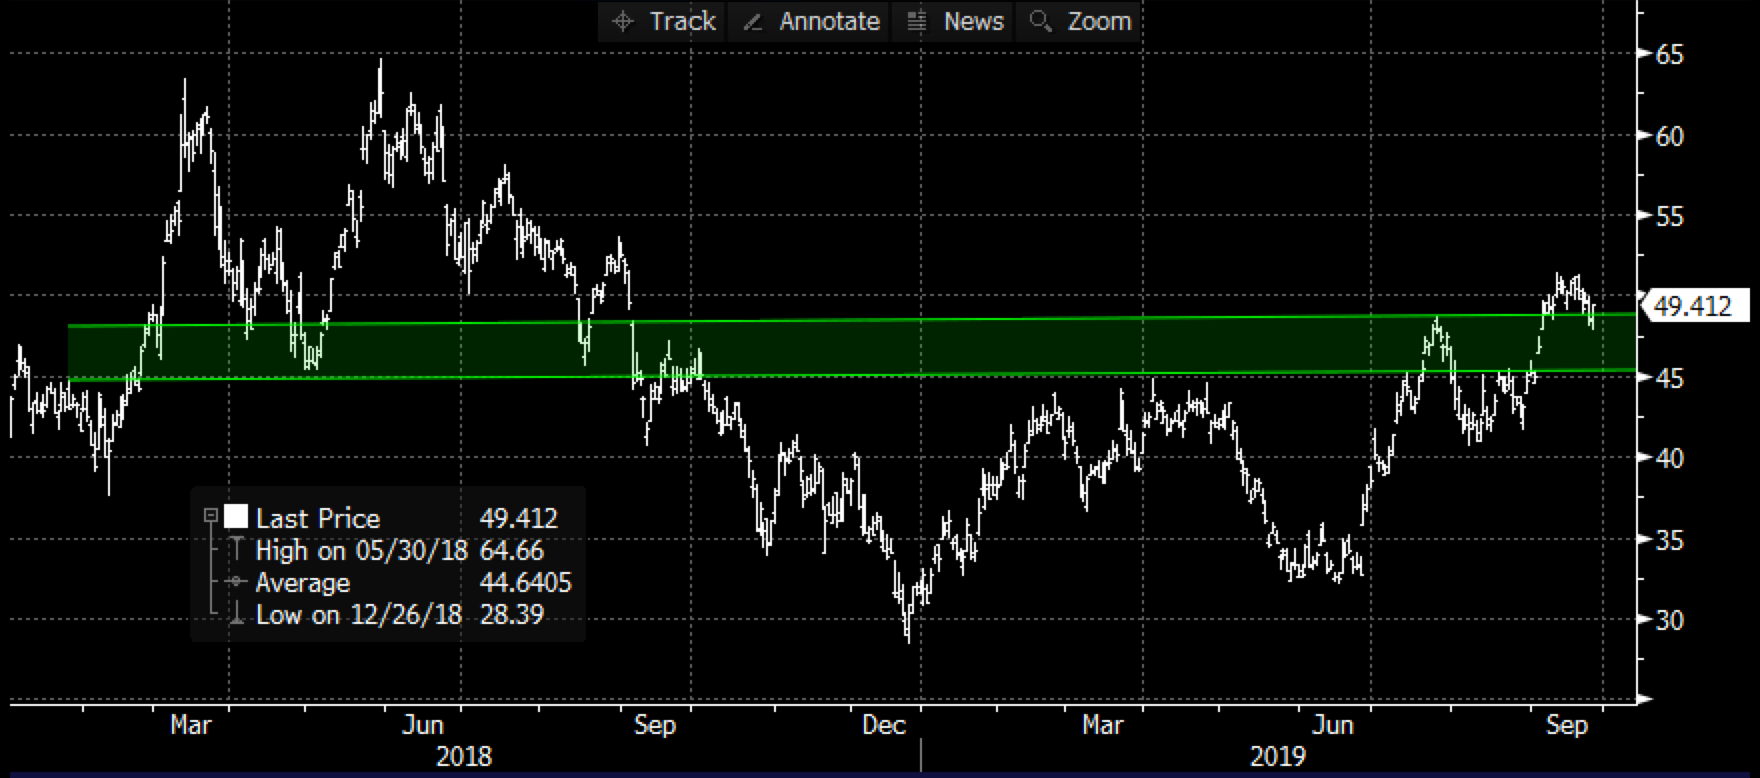
Shares of MU are up 56% on the year, just 4% from its 52-week highs made two weeks ago and consolidating just above a key technical breakdown level from last September that saw the stock go from $45 to below $30 in a matter months after it had already dropped 30% from its then 52-week highs made in May 2018. MU in 2018 had a 56% peak to trough decline, and from the December lows the stock has risen 76%:
What to expect into the print? Credit Suisse’s John Pitzer who rates the stock an Outperform with a $90 twelve-month price target had an interesting comment in his preview note to clients on Sept 22nd (emphasis mine):
While NT sentiment into earnings has turned decidedly positive, perhaps dampening impact of a beat/raise… A profitable cycle bottom for the first time and supply/demand dynamic which supports EPS potential over the next 18-24 months greater than prior cycle peak CY18 EPS of $12.48 – should provide ample multiple expansion. While the stock has increased ~65% from cycle lows and is only 20% from multi-year highs – we still see support for our $90 PT – while 38.2 times CY20 EPS and 49.3x CY20 EV/FCF, its ~6x our peak EPS potential and ~10x peak EV/FCF. Risks: pricing pressure; execution in NAND and in converting to 1z DRAM; and potential new entrants from China.
Clear take-away is that the stock’s 20% gain in just the last month, and most of its year-to-date gains coming since the start of July, investors might be anticipating any and all good news for the time being.
I don’t personally have a strong view, MU due to its cyclicality and its always ridiculously low multiple tends to be a great trading stock for those looking for overshoots both to the upside and the downside.
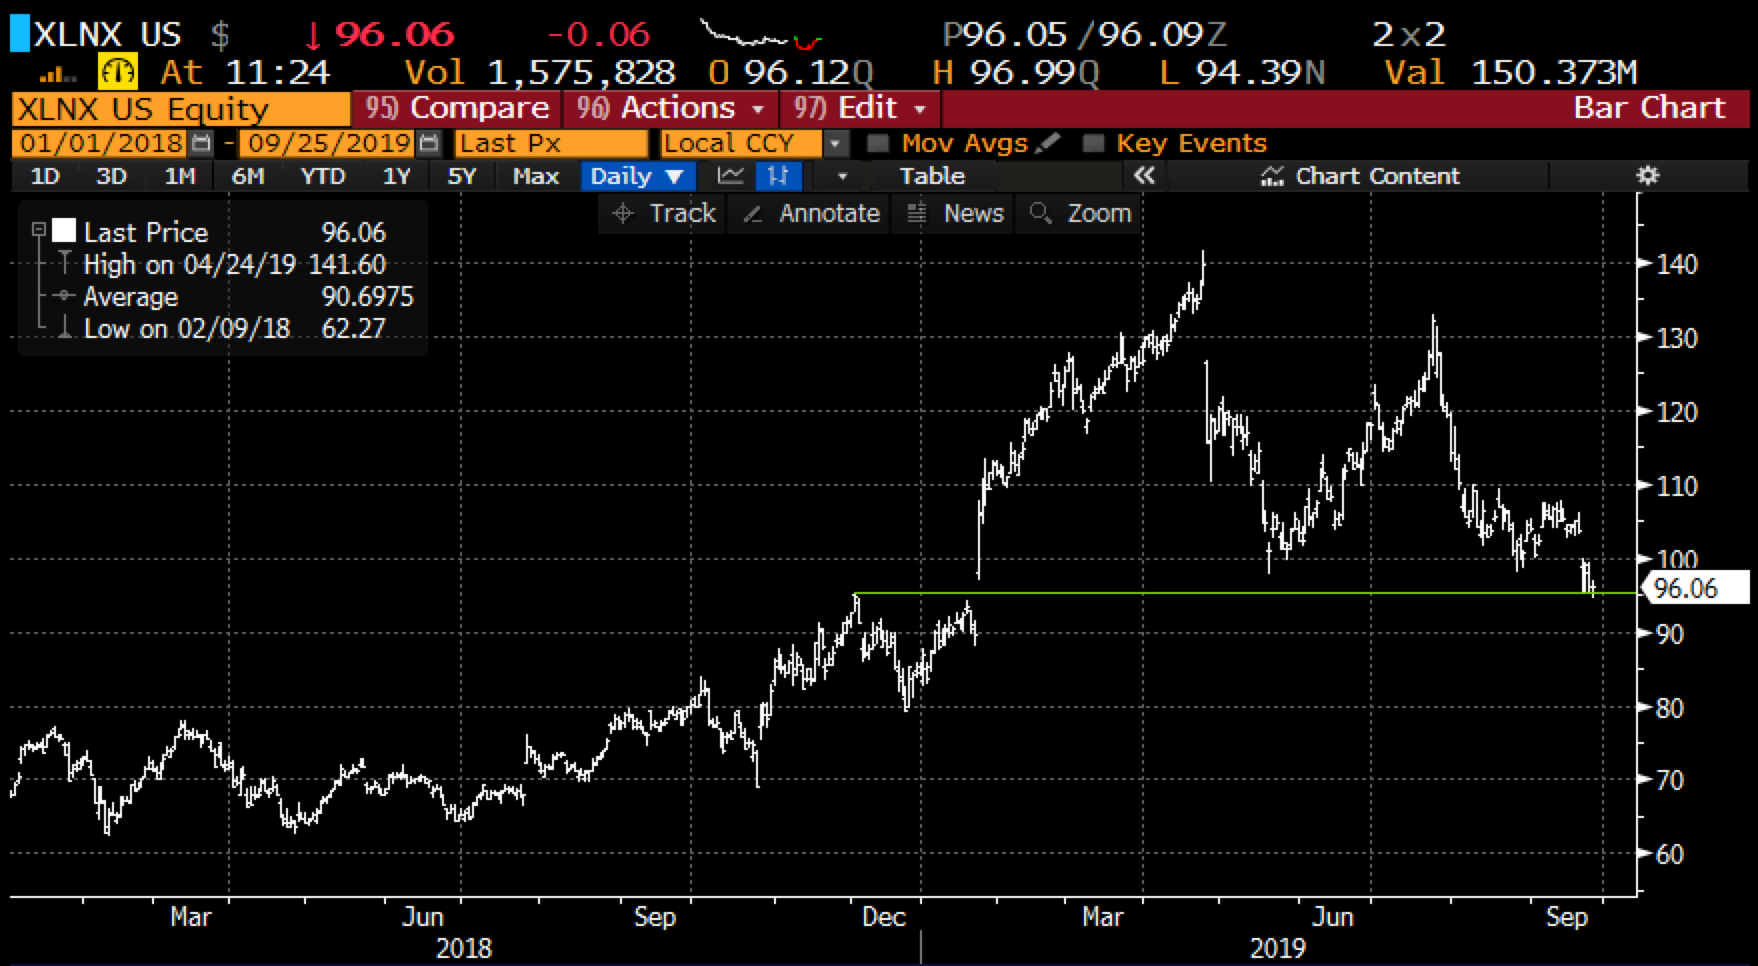
As for the broader semiconductor space, it is worth noting one former stock market darling Xilinx (XLNX) is approaching key technical support, down 33% from its all-time highs made in April, having filled in its entire earnings gap from late January, yet still up nearly 13% on the year:
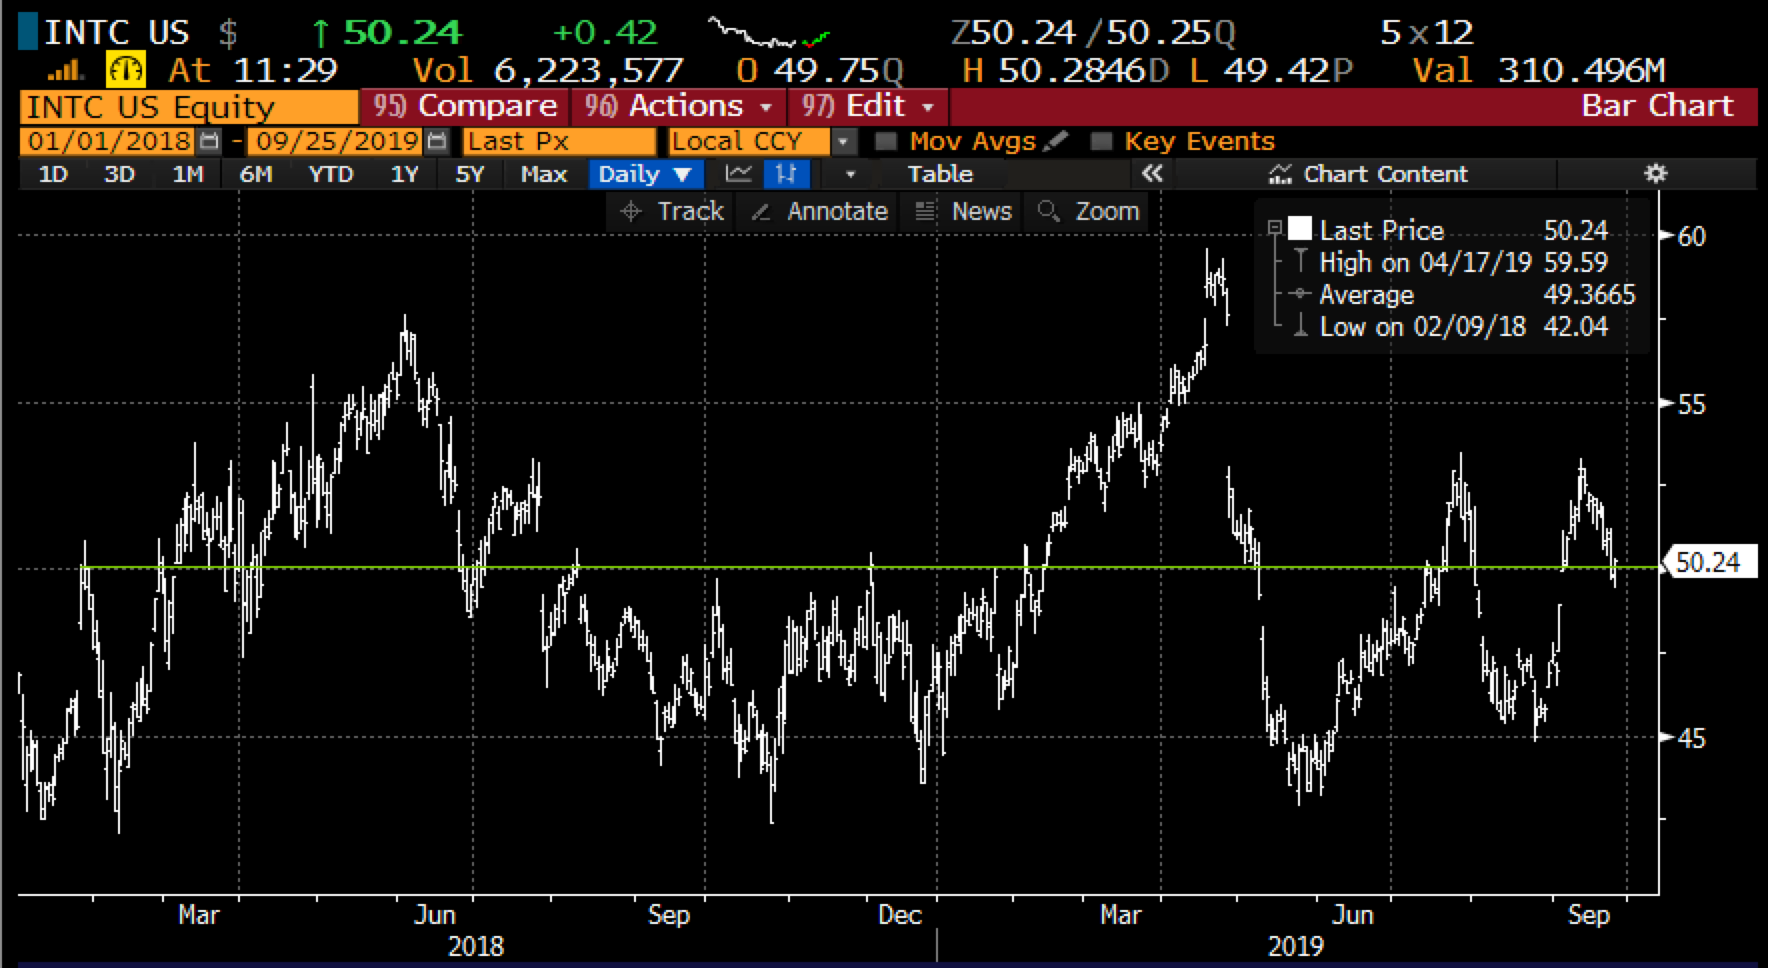
Intel (INTC) the largest semi by market cap and sales lags the broad market, only up 7% on the year, well below the SMH’s (etf that tracks the group) 35% ytd gains, trading smack dab in the middle of its 18-month range:
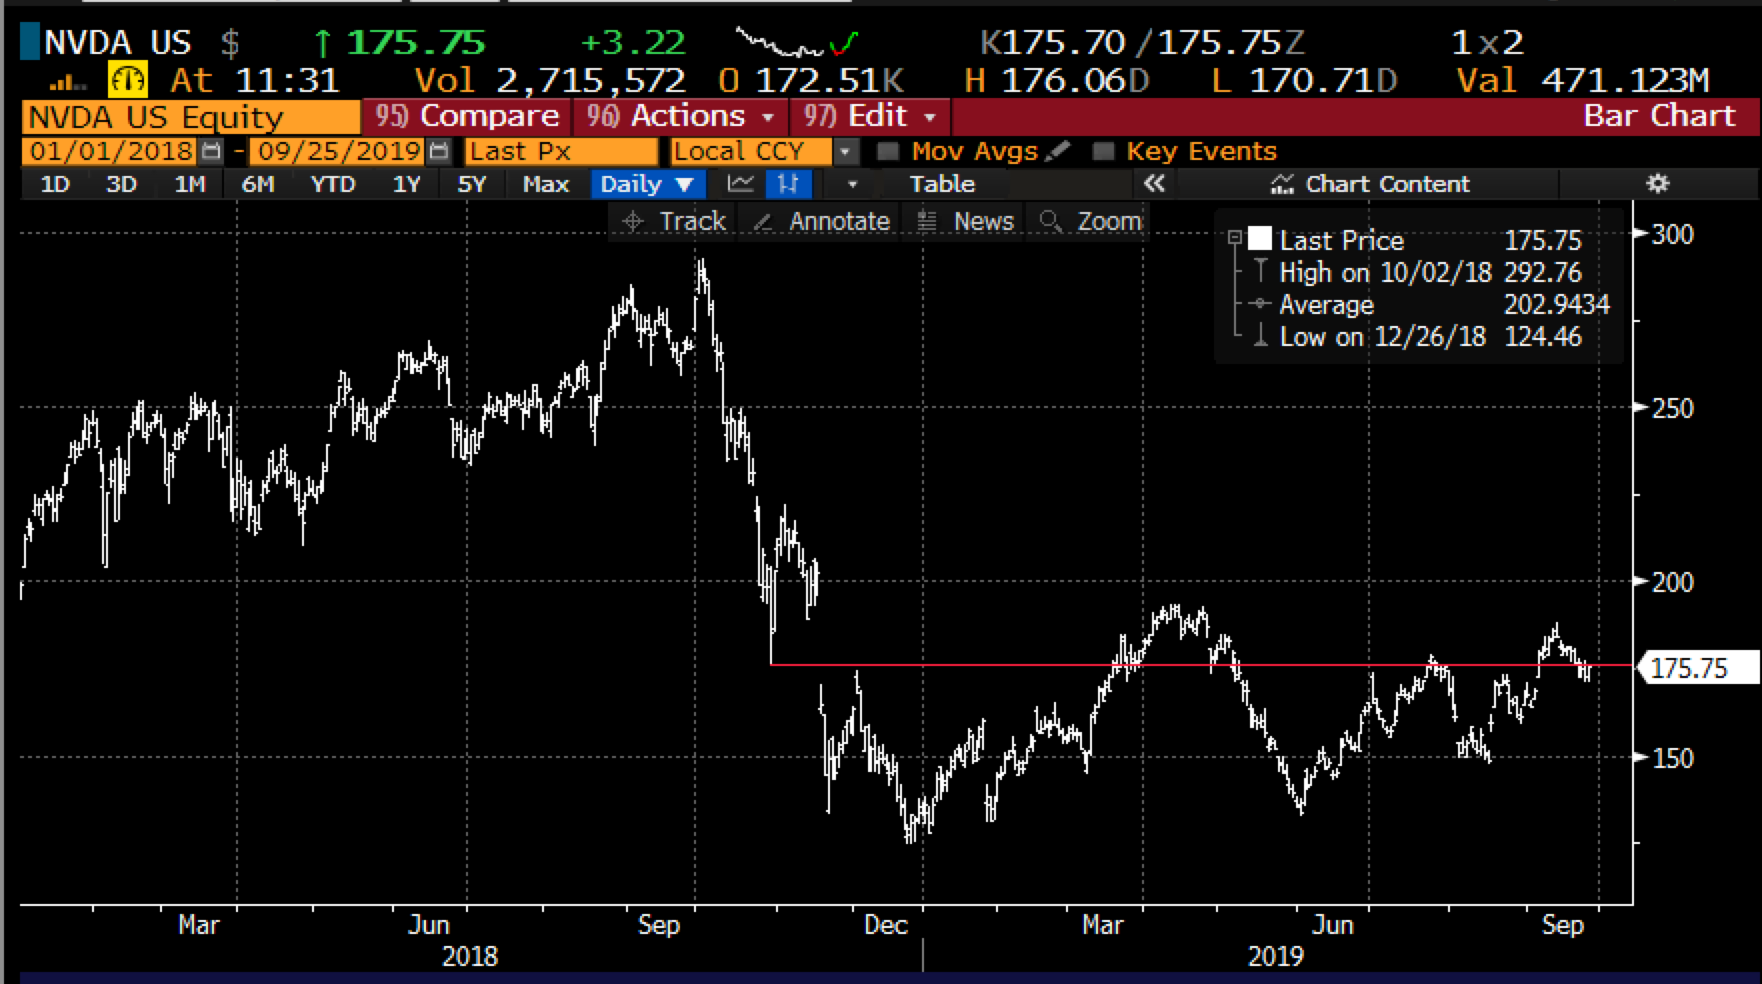
Graphics chip makers like NVDA have kept pace with the SMH, up similarly on the year, but still in a massive bear market, down 40% from last year’s all-time highs:
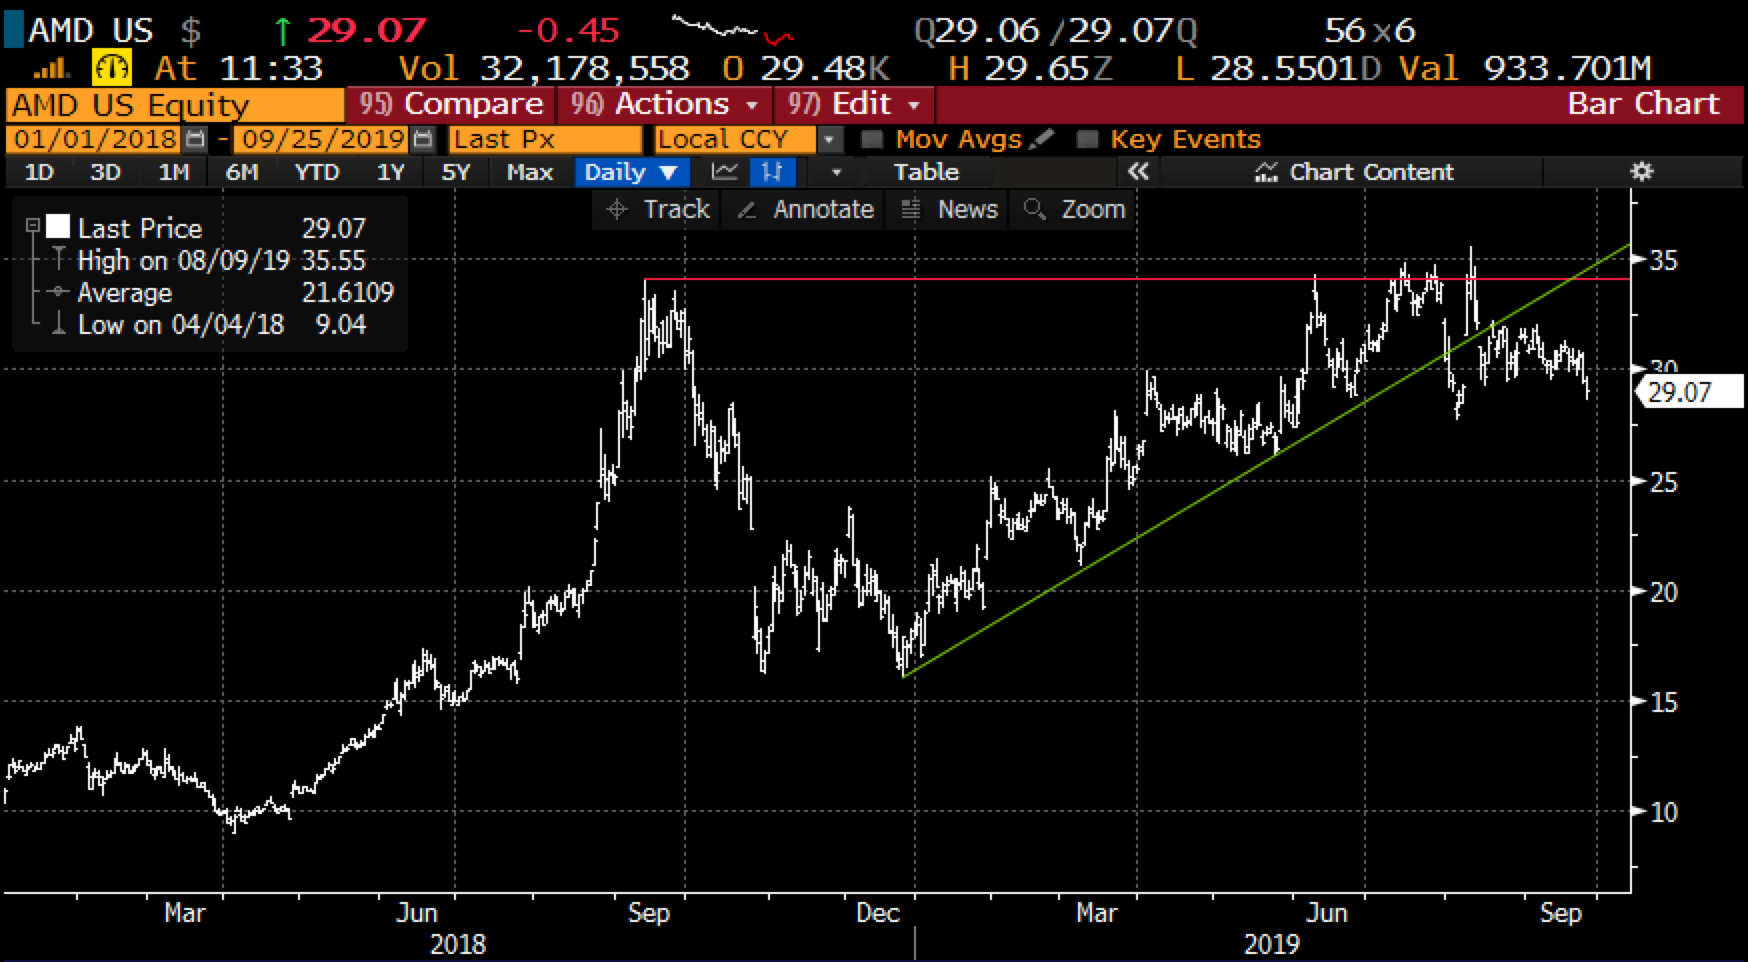
Advanced Micro Devices (AMD) had been a rocket until late, still up 57% on the year, but with a troubling technical set-up, rejected at last September’s multi-year high recently and having broken the uptrend that had been in place from the December 2018 lows:
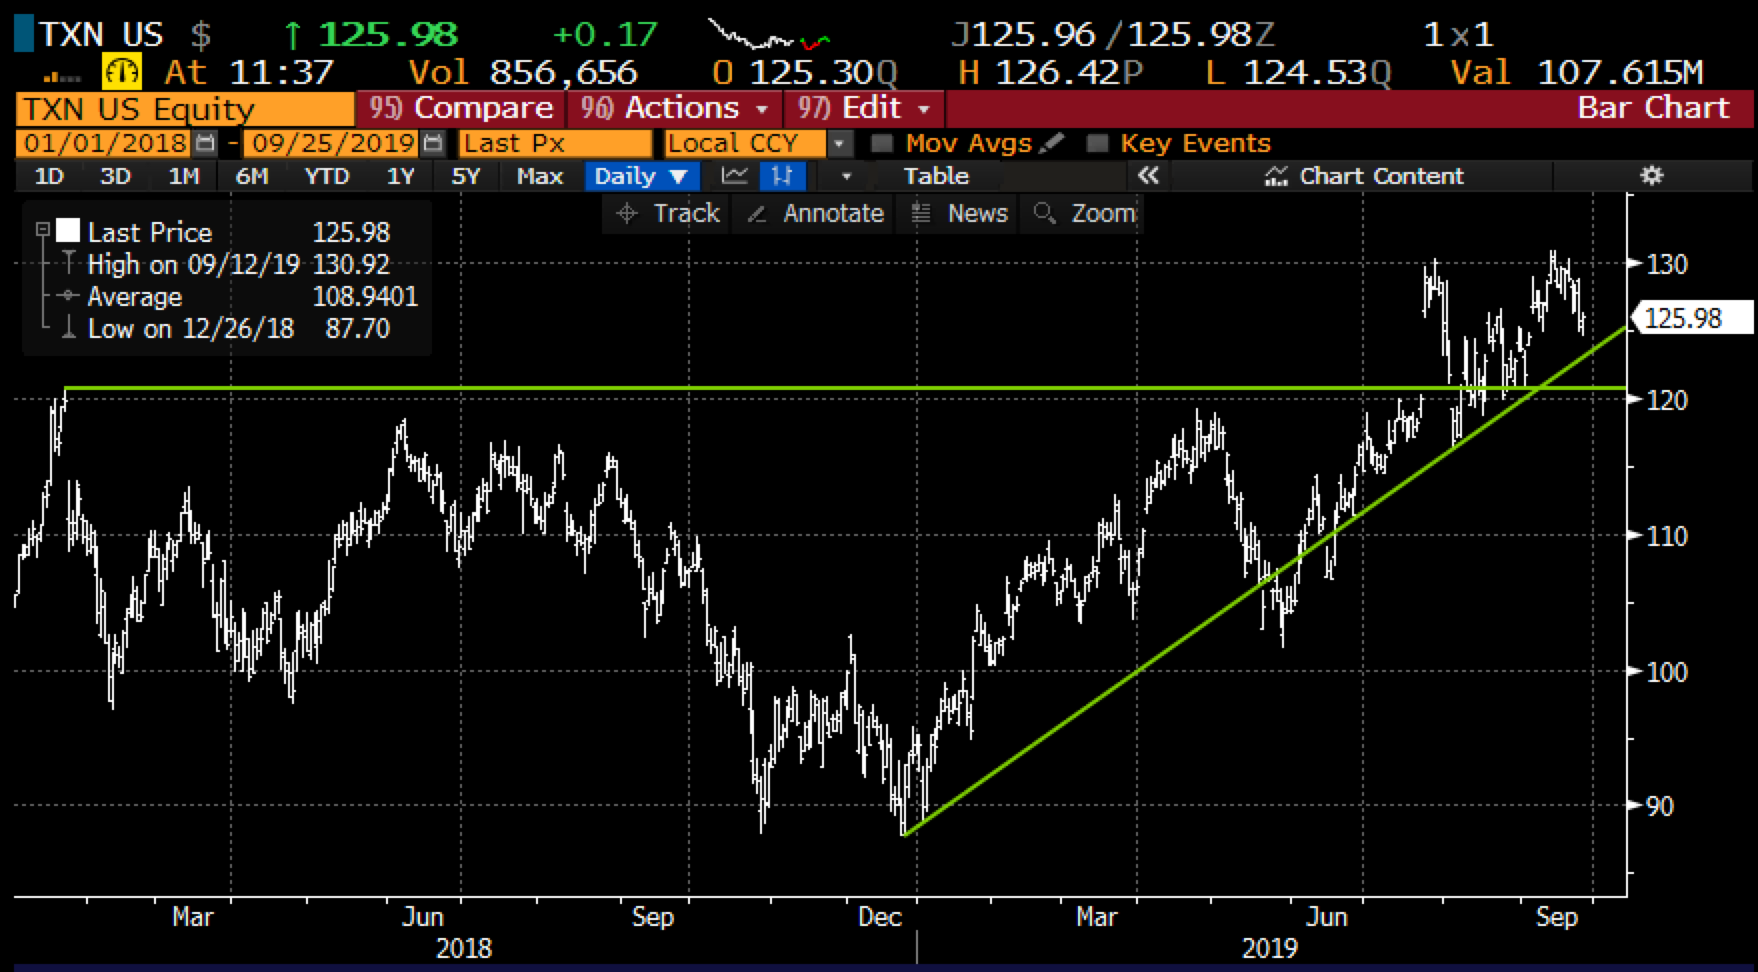
As we head into quarter-end, some semi’s like Texas Instruments (TXN) whose commentary about the bottoming of the semi-cycle in July sent the stock to new all-time highs will be closely watched, any downgrade to that view would cause the stock and the space likely to drop precipitously. While any reinforcement of that view that they are one quarter closer to what they called earlier in the year the mid-point of a five-quarter downturn would cause investors to pile in with the prior breakout level of $120 serving as obvious technical support:
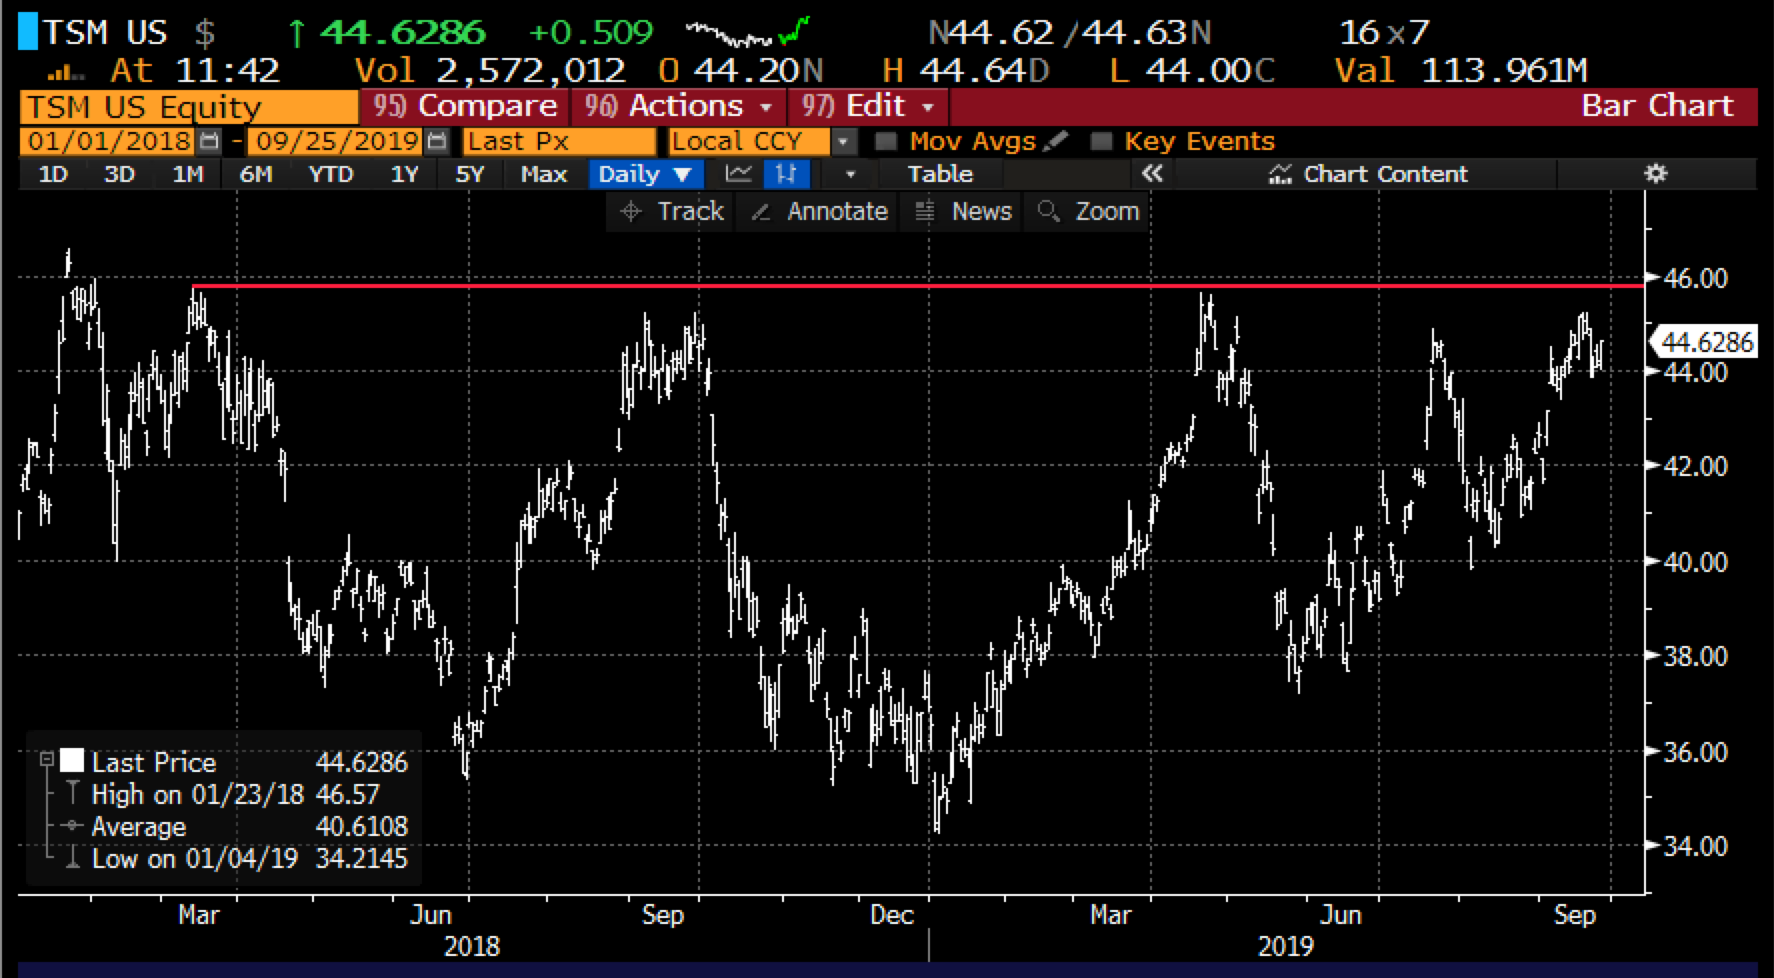
The most constructive chart in the whole space might be Taiwan Semiconductor (TSM) once again approaching a resistance level between $44 and $46 that it has been thrown-back from hard on its last five attempts since January 2018:
So here is the thing… TSM, TXN and the chart of the SMH, in general, look fairly constructive from purely a technical standpoint. But some of the recent commentaries about fundamentals in my mind seems like it could be reversed easily if there is no progress on a trade deal. And without being political, it is my view that any impeachment proceedings for trump make a substantive trade deal prior to the 2020 election very unlikely. Leaving the existing tariffs in place, and possibly raising them will continue to be a drag on the global economy. Don’t take my word for it, just look at German auto manufacturing, an industry increasingly using all sorts of chips in their vehicles, per Bloomberg:
Amid trade wars and plunging China sales, the number of cars rolling off Germany’s production lines has dropped by 12% this year and exports by 14%. European auto sales fell 3% in the first eight months of 2019. With demand expected to remain weak for a couple of years,
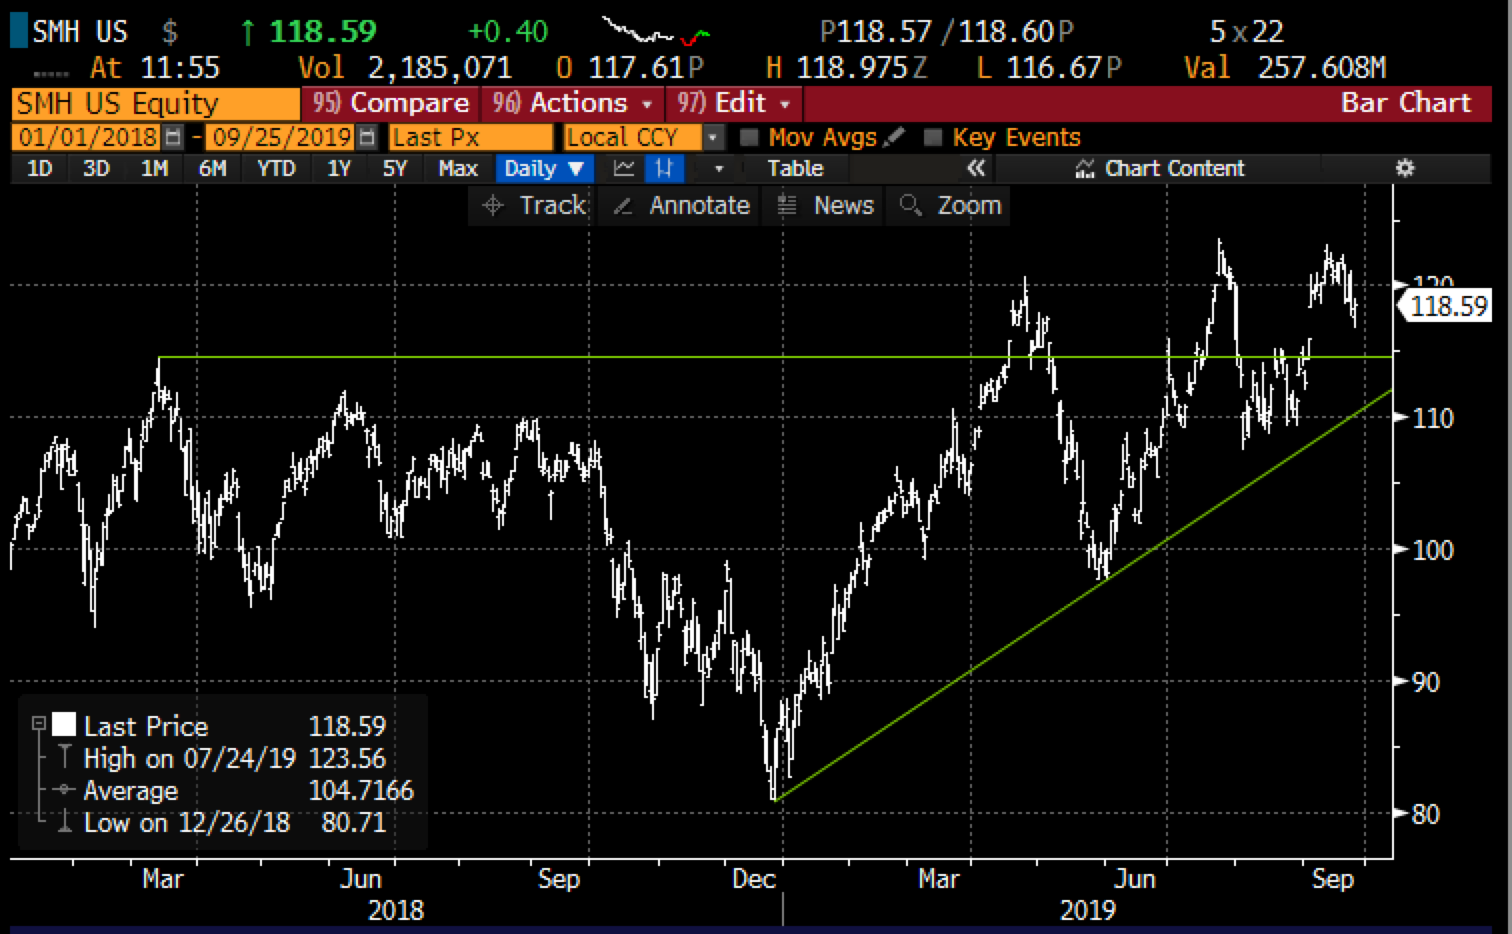
As we get to quarter-end, especially if MU’s outlook is less than rosy I suspect we will see some negative pre-announcements, and while the SMH looks constructive, we could see a retracement the uptrend that has been in place since the Dec lows near $110:
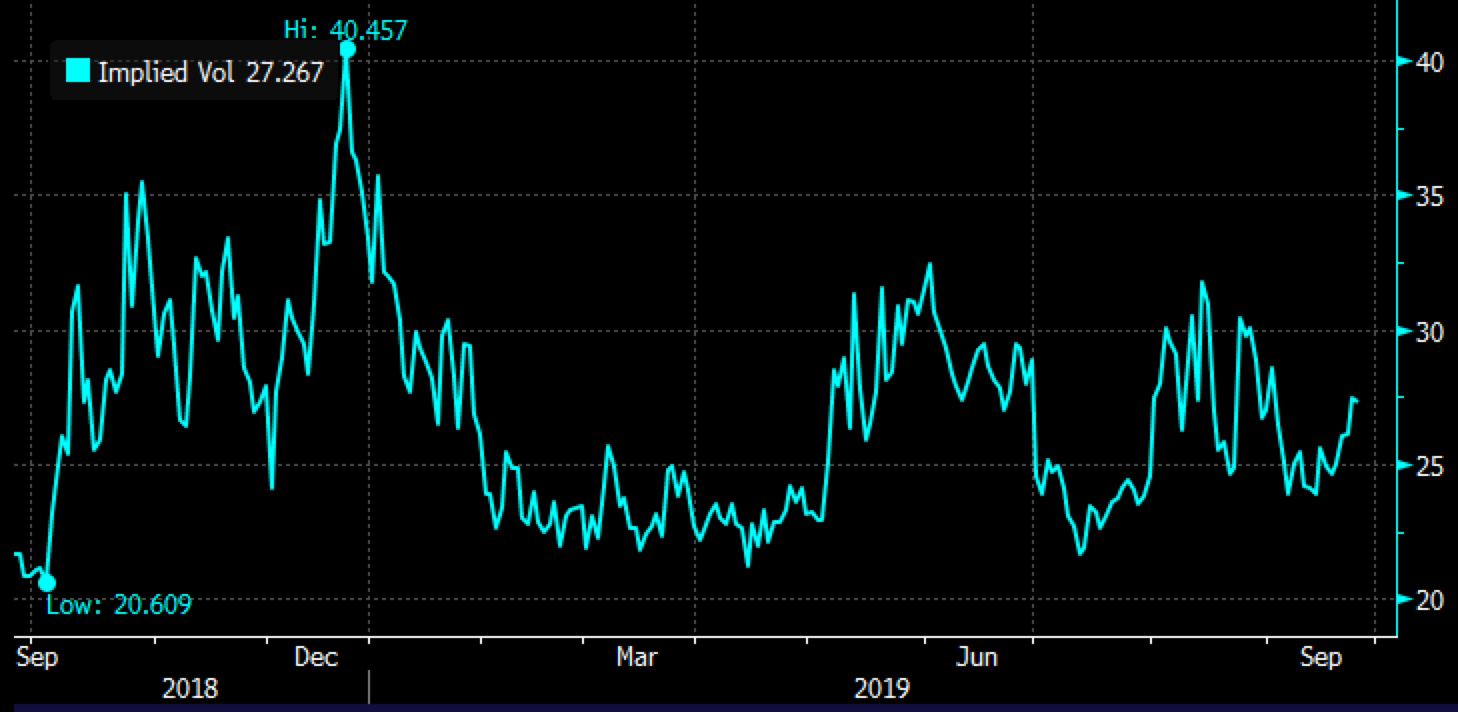
Short-dated options prices seem reasonable for those looking to make long-premium directional bets, with 30-day at the money implied volatility at 27%, basically in-line with its one year average:
So what’s the trade? If I were inclined to play for a re-test of the uptrend I might consider looking out to Nov expiration to capture most the of the SMH component’s earnings
Bearish Trade Idea: SMH ($119) Buy Nov 119 – 108 put spread for $3
-Buy to open 1 Nov 119 put for $4.60
-Sell to open 1 Nov 108 put at $1.60
Break-even on Nov expiration:
Profits of up to 8 between 116 and 108 with max gain of 8 at 108 or lower
Losses of up to 3 between 116 and 119 with max loss of 3 at 119 or higher
Rationale: this trade idea risks 2.5% of etf price, breaks even down 3% from the current level and offers a payout of up to 6.75 of the etf price if it is down 10% in a little less than two months. I would add that the SMH has made two new highs this year, in April the stock dropped nearly 20% from the then high near current levels, In July the SMH made a slightly higher high by a few percent and then dropped 13% from those levels. Earlier this month the etf failed to make a new high from July and the etf is now down 3% from those levels.