There are good acronyms and bad acronyms. CNBC’s Jim Cramer famously came up with FANG a few years back to describe the growing influence of shares of Facebook, Amazon, Netflix, and Google on broad market sentiment. While now president trump launched his candidacy on a slogan, that turned into a hat, and now represents a very divisive form of politics. Thinking about both of these acronyms last October, and considering the four largest market cap stocks in the U.S. (and the world for that matter) Microsoft (MSFT), Apple (AAPL), Alphabet (GOOGL) and Amazon (AMZN), which at the time made up $3.6 trillion in market cap, that they were the ones to watch, and I could make my mark in the useless acronym game by Making Acronyms Great Again, or at least attempt to rehabilitate one that I find particularly grating. So I started writing and referring to them as a group:
October 10th, 2018: Many Bad Stocks on Both Sides #MAGA
how is it that we are seeing new 52-week lows (many in serious correction territory) by some of the most economically sensitive groups in the market and the SPX is less than 4% from its highs and still up 6% on the year, and up 12% from the 52-week low made in January when investors had similar concerns as to they do now? The answer is quite simple MAGA… Microsoft (MSFT) Apple (AAPL), Alphabet (GOOGL), and Amazon (AMZN), make up $3.6 trillion in market cap, or about 15% of the weight of the SPX, despite their recent collective declines, they are up massively on the year, especially for their size,: MSFT up 27% ytd, AAPL up 32%, GOOGL up 7% and AMZN up 55%. They more than make up for all of the ytd performance in the index and shit-ton of the bad performance.
October 17th, 2018: MAGA is the QQQ, the QQQ is MAGA
While NFLX’s $156 billion market capitalization is nothing to shake a stick at, it is not particularly that impactful, aside from a sentiment standpoint when you consider the fact that MAGA (MSFT, AAPL, GOOGL & AMZN) make up a combined $3.6 Trillion in market cap, or about 14% of the SPY, the etf that tracks the S&P 500, and 42% of the QQQ, the etf that tracks the Nasdaq 100. Through in Facebook (FB) and you get to nearly 50% of the weight of the QQQ. As these stocks go, so goes the market, and I guess most importantly, if they all go in the same direction as they did last Wednesday and Thursday, and you see what a massive drag they can be.
January 18th, 2019: MAGA Is Eating the Stock Market
Regular readers know where I am going with this.. MAGA, not the political virus, but the concentration of MSFT, AAPL, GOOGL & AMZN in the Nasdaq 100 (NDX), and more importantly the crowding in these names over the last few years, and what had become investor reliance on these stock’s out-performance, which masked a lot of bad performance in the rest of the stock market. MAGA makes up nearly 38% of the NDX, or about $3.1 trillion in market cap, down about $4 trillion in September.
Its been my view that the broad market can not rally without a sustained recovery in MAGA, and if we lose stocks like MSFT that have out-performed its MAGA peers and the others are too languish, then the rotations that we see in other sectors in the S&P 500 (SPX) are merely like moving the deck chairs around on the studdering Titanic. The other groups just don’t have the ability to lift the broad market.
February 19th, 2019: It’s Like Alien vs Predator But It’s FAANG vs MAGA
I guess my simple point is this, while the concentration in FAANG on the way up powered much of the gains in the broad market, it also masked a lot of bad performance. Now we are seeing poor relative performance from the horses that got us to the 2018 highs and I am not sure the breadth that we are seeing in smaller tech names that are making new highs is enough to reignite the bull.
The broad market is levitating, despite the ability for mega-cap tech to and groups like banks that you would like to see as a sort of sign of strength relating to economic optimism. While you often hear things like “buy protection when you can, not when you need to” from options peeps on TV, I am not sure I always agree with that, especially as we come off a sustained period of high volatility.
June 25th, 2019: The M in MAGA
One of the main reasons I am focused on MAGA (MSFT, AAPL, GOOGL & AMZN) as opposed to the nifty FANG is that these four stocks at their highs last year made up $4 trillion in market cap, or almost 45% of the weight of the Nasdaq 100, FANG while cute, is more interesting to me from a sentiment standpoint, but what is most important to this discussion is that all of these stocks are north of 25% on the year (except GOOGL), and all but MSFT have confirmed the new highs in the SPX. It has been my view that given the current leadership in the market, it would be nearly impossible for the SPX to break out of the 18-month range and make material new highs without the participation of MAGA as a group.
My friends at CNBC liked the acronym so much they had a hat and a graphic made for me.
My view for quite some time has been for the S&P 500 (SPX) to establish a new range above the series of incremental new highs since January 2018 that it would take MAGA to lead the way. MSFT has done that, but AAPL and AMZN have sorely lagged, failing to confirm any of the new highs in the SPX in the last year, and while GOOGL did this summer it was quickly rejected and sits below the prior highs, despite the SPX once again flirting with a new one.
Which leads me to the last few weeks… While I am not bullish on the SPX at 3000 (I wasn’t at 2900 either) I have been constructive on the prospects of the MAGA names making new highs or at least testing their prior ones…
On Aug 29th I wrote a post about Microsoft The M in MAGA Stands for Monster and discussed my view on the stock and offered a defined risk way to play for new highs on CNBC’s Options Action on Aug 30th:
If the NDX/QQQ is going to break out to new highs this fall, I suspect it will be led my MSFT, and for the index to establish a new range above the prior highs will need the help of the rest of MAGA.
…
The next identifiable catalyst for MSFT will be their fiscal Q1 results due out the last week of October, but in the meantime targeting a breakout to new highs with defined risk make sense for those who think the Nasdaq which is down a little less than 1% on the quarter makes a push into the end of Sept.
The following week on September 6th I previewed Apple’s (AAPL) upcoming iPhone 11 launch event (One More Thing) and detailed a defined risk way to play on CNBC’s Options Action:
For those looking to be constructive on the trade talks, and think that AAPL could be a good vehicle in which to do so, near the money calls in AAPL in Oct expiration (that would expire before earnings) could be a good way to play with defined risk, For instance, with the sock at $213.50 the Oct 215 calls are offered at $6.50 or about 3% of the stock for a break-even up about 3.5% at $221.50 which would mark an important technical breakout level. If the stock were to make a quick move above that level I might look to either spread these calls by selling a higher strike call in Oct expiration, reducing the premium at risk, or roll up and out a bit to capture earnings.
And the week after that on September 13th I discussed Alphabet’s (GOOGL) relative strength in front of no shortage of regulatory headwinds (Chairman Nadler, Don’t You Ever Google Yourself?) and discussed a defined risk way to play for a retest of the prior highs into and out of GOOGL’s Q3 earnings in late October:
If you think there is a chance the stock puts up similar results in Q3 and can guide higher for Q4, then I suspect investors will be gunning this stock into year-end above the prior highs at $1300. It makes sense after the recent 7% rally in the stock to look to play for a sort of near term consolidation, and look to finance calls that will catch the earnings event in Nov expiration by selling some shorted dated out of the money premium that does not catch earnings. This trade structure is called a call calendar and here is one that makes sense if you think that GOOGL can test or make new highs post their Q3 results in late October…
Since August 29th MSFT has broken out of a three-month range and just yesterday made a new all-time high, AAPL is back above its post-earnings gap level on July 31st and within 5% of its all-time high made last September at $233 and GOOGL is making a run at it’s gap following its earnings in late July and also within 5% of its all-time highs. To put it bluntly, these three charts look very constructive.
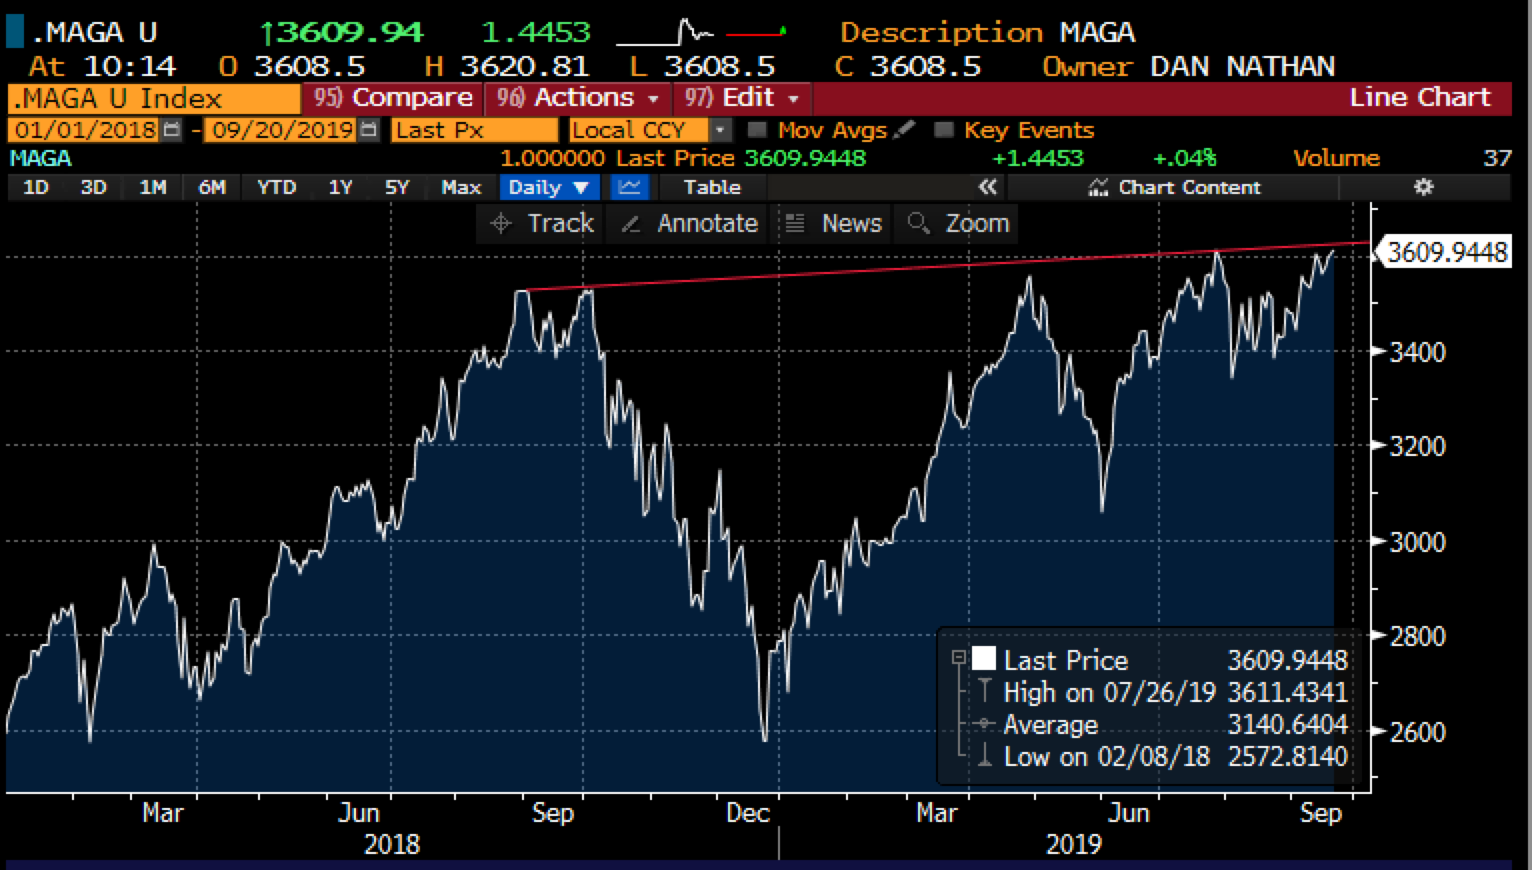
MAGA as a group is about to make it’s 4th higher high in the last year.
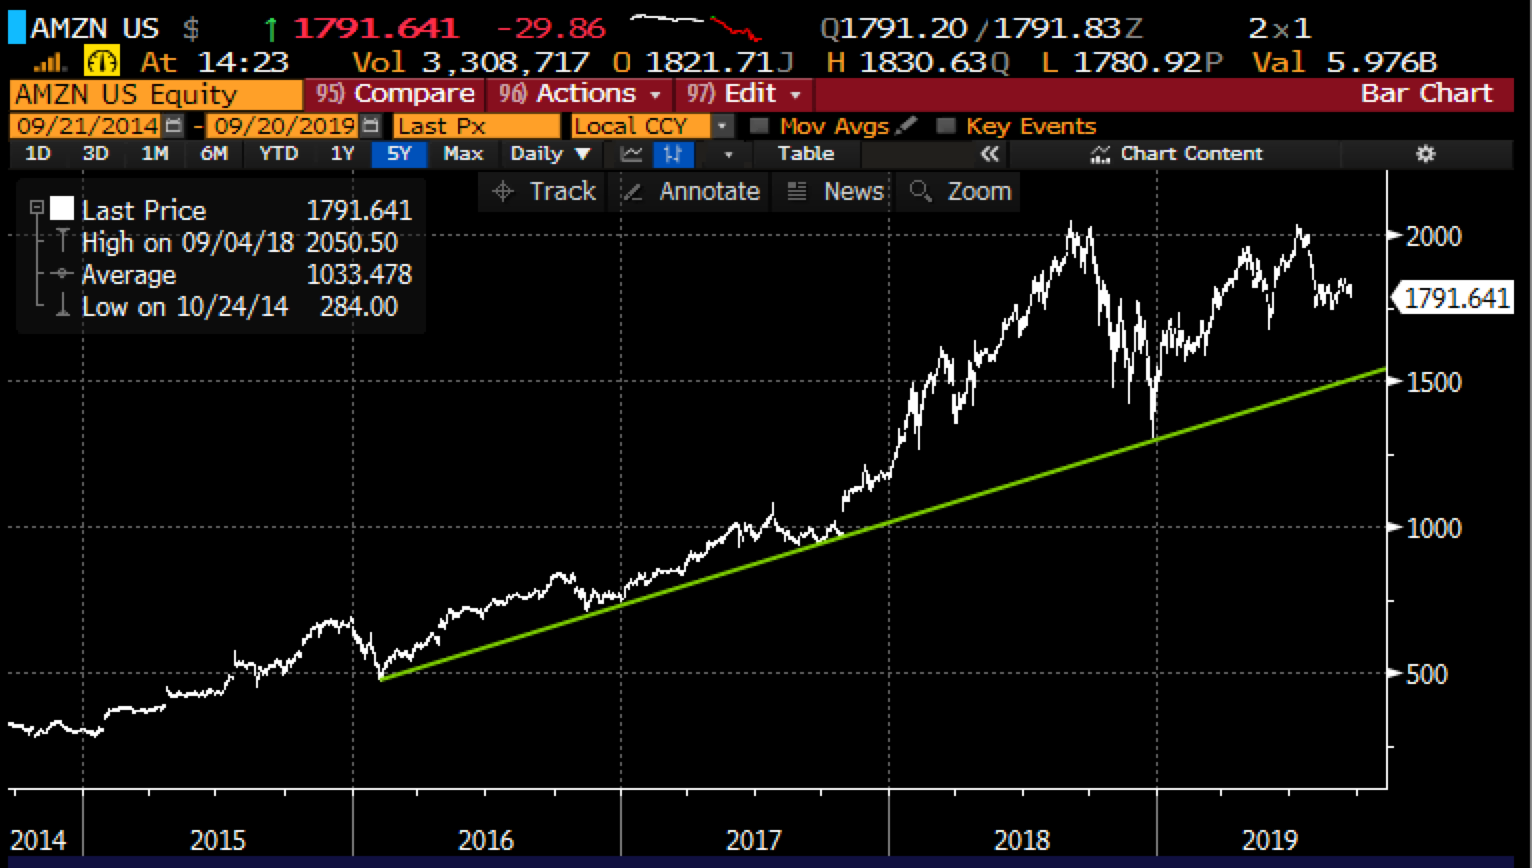
Which brings us to Amazon… which is up 21% on the year, interestingly a tad less than the Nasdaq composites’ 23% ytd gains, and also sits 11% below its all-time high made last September. The simplest indictment of the stock from a trading standpoint is that since breaking the uptrend that had been in place since late December, the stock has failed to retake it, and has clung to what some might see as support at its 200-day moving average (yellow line):
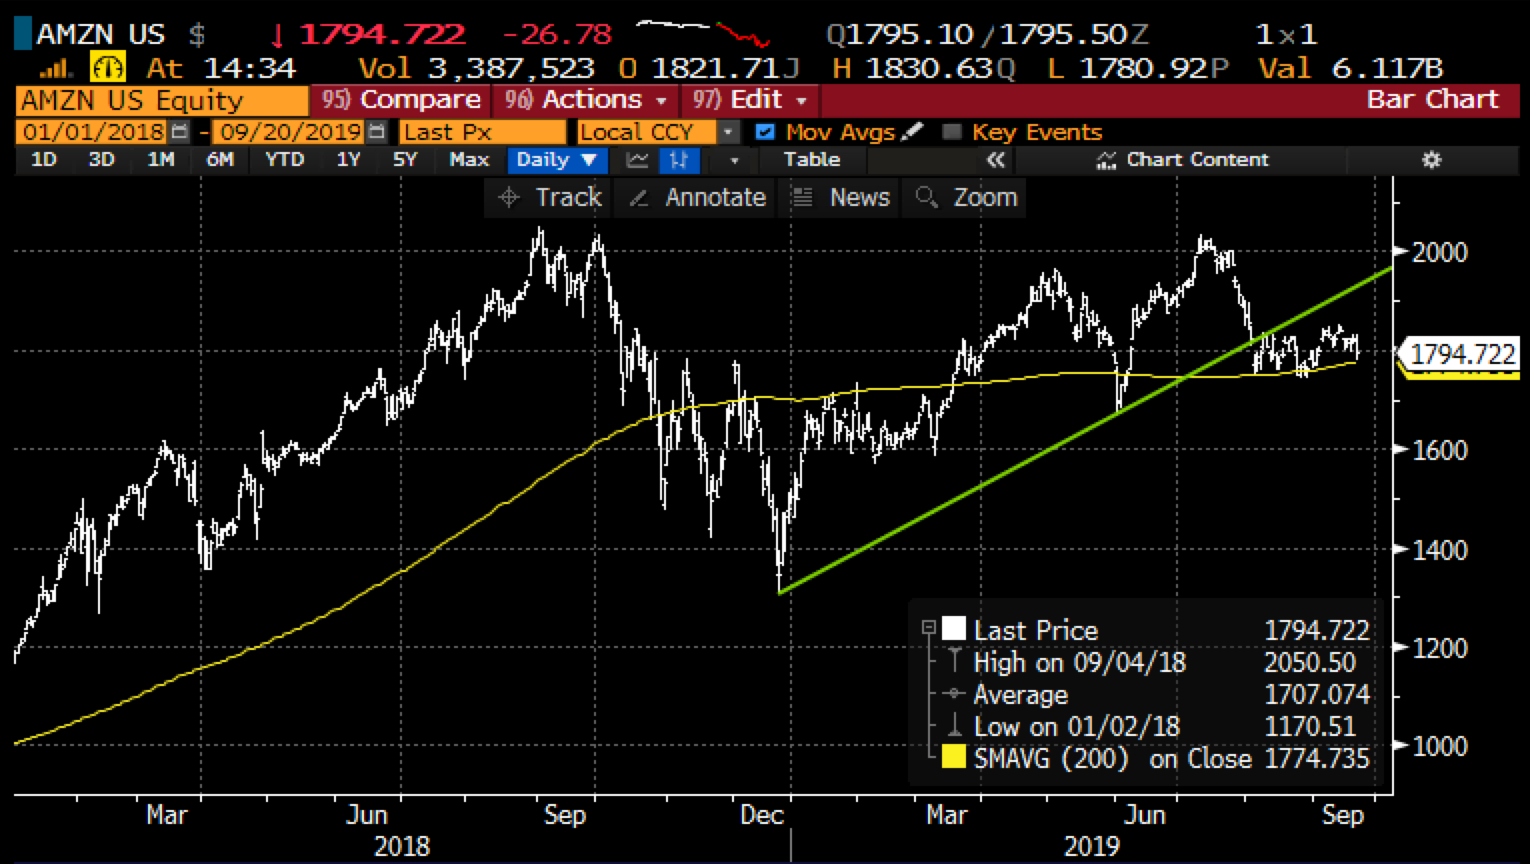
To my eye, this support is precarious at best and it makes sense to consider what might be some fundamental headwinds as we get deeper into the fall, closer to their Q3 results which should drop in a but a month.
As we think about the quarter and their guidance for the Q4 Holiday season it makes sense to consider what impacted guidance back in July that has put a lid on the stock for the time being.
Earlier in the month, RBC Capital’s top-rated internet analyst Mark Mahaney took a look at the main issue in the last quarter, the effects of one-day prime shipping, as it had a positive impact on “accelerating Revenue & Unit growth” but also “demonstrated accelerating Shipping & Fulfillment costs and headcount growth, with an incremental cost of $800MM+.” Mark sees this as a clear long term benefit:
Based on extensive discussions with industry experts and with senior management, we tested a series of incremental revenue impacts from One-Day, based on increased Prime adoption and increased spend per Prime Household (esp. frequency boosts). We estimate that a 150-300bp boost in global Prime Adoption – from ~24% in 2018 – and a 5%-11% boost in annual spend per Prime household – from ~$1,800 in 2018 – would generate a 7%-15% increase in total AMZN revenue – or $11B-$24B. THAT’s material. Win.
But in the near term, and especially in front of the holiday season, Q4 guidance might uniquely be impacted by the added headcount and fulfillment costs. The stock’s price action of late is telling that investors are worried about something, especially as the rest of MAGA looks poised to trade back at their highs.
So what’s the trade? Look to buy near the money put spreads that catch Q3 earnings in late October:
Bearish Trade Idea: AMZN ($1790) Buy Nov 1760 – 1500 Put Spread for $50
-Buy to open 1 Nov 1760 Put for $60
-Sell to open 1 Nov 1500 put at $10
Break-even on Nov expiration:
This trade breaks-even at 1710, down 4.5% from the trading level, risks 2.8% of the stock price and has a max potential profit of up to 210 (or 12%) if the stock is 1500 or lower in two months, down 13% from the current level.
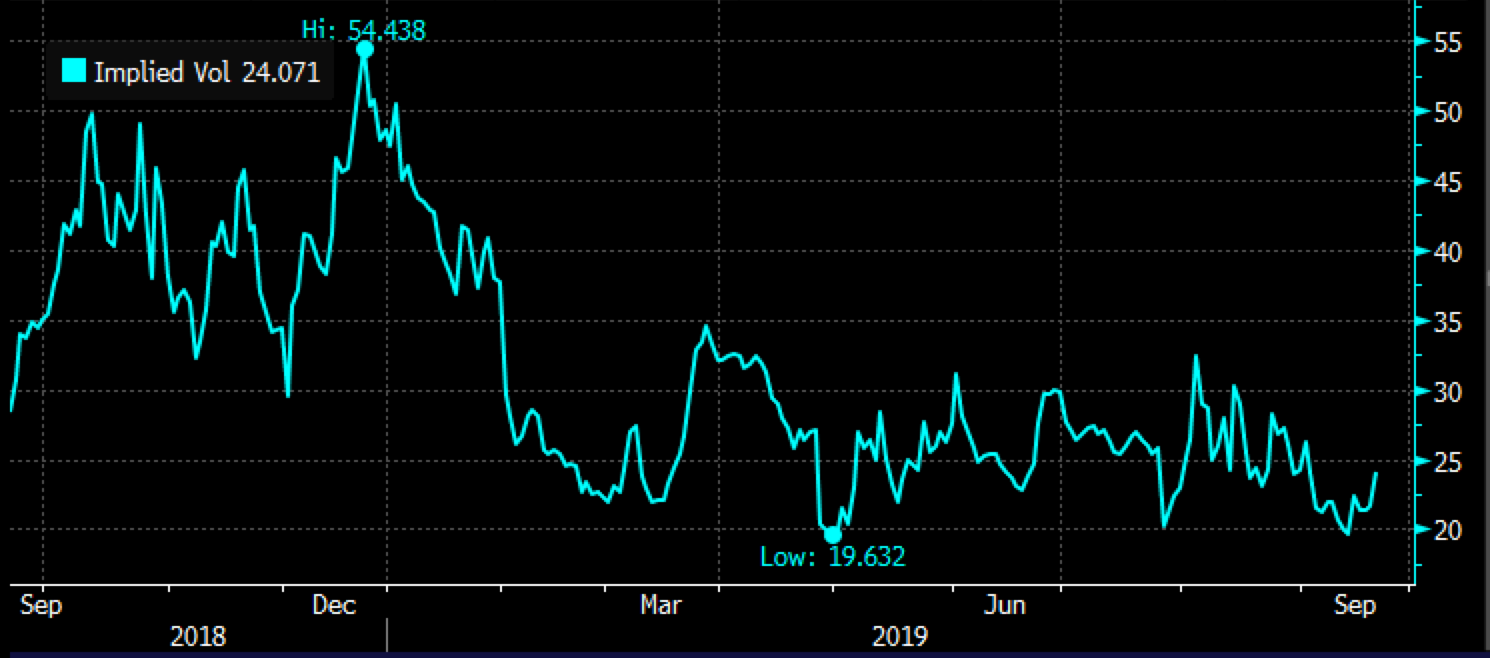
Rationale: why puts or put spreads? short-dated options premiums are fairly cheap with 30-day at them money implied volatility at just 24%, well below the 1year average of 31%:
Why even bother selling the1500 put at just $10, that level is massive long term support.