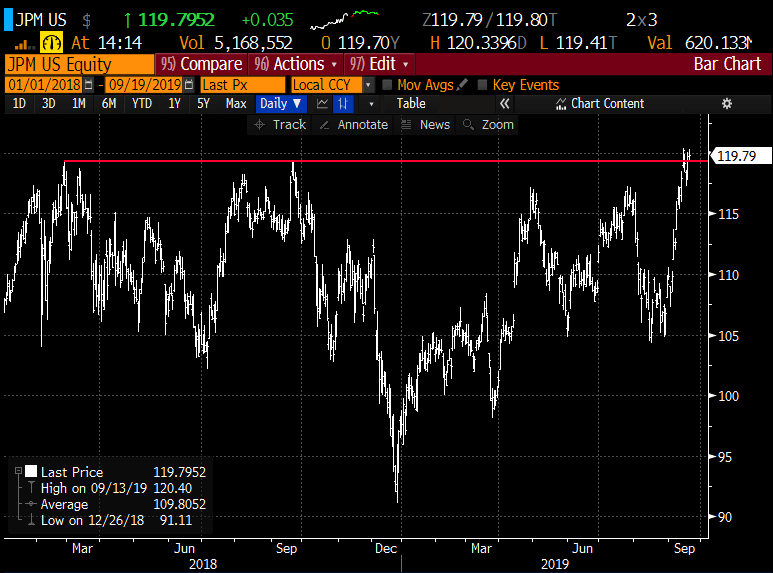
I think it is safe to say that it has been a very long time that investors have been able to say “wow, that mega-cap U.S. bank stock is breaking out to new highs”. Well, last week when JP Morgan (JPM) finally broke out above its two prior all-time highs last year. After the stock’s 15% rally in the last month, those thinking about buying the breakout have to ask themselves whether or not it is just another fakeout??
The XLF, the S&P Financial Select ETF (of which JPM is the second-highest weighted stock at 11.5% behind Berkshire Hathaway at 12.40%) is also approaching an important technical level, it’s 2019 high despite still being down about 5.5% from its 2018 high:
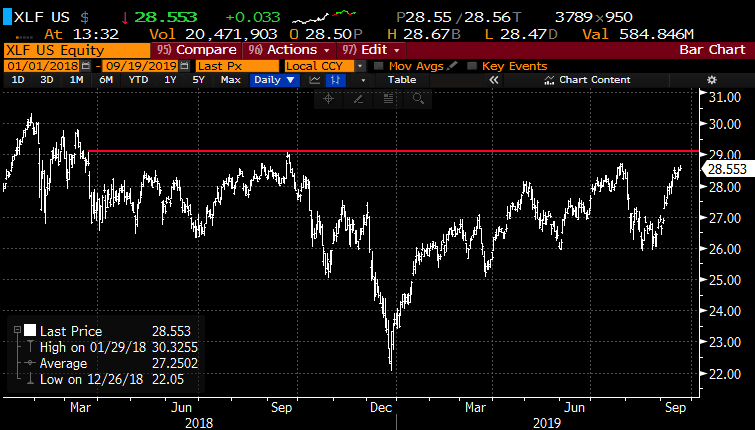
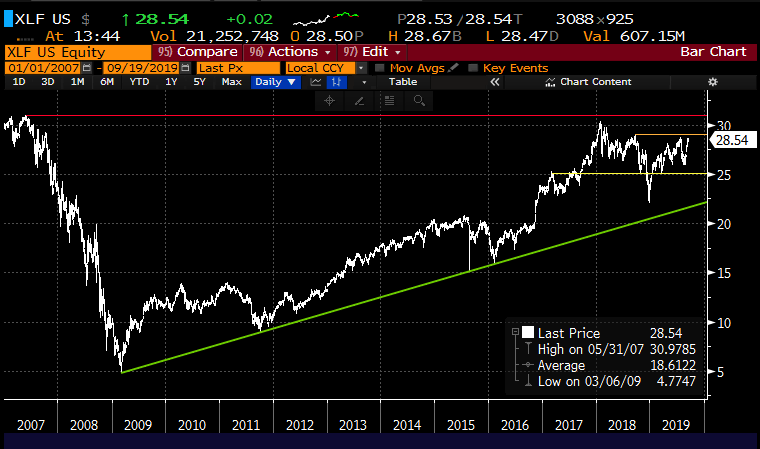
So for those playing along at home, the XLF needs to get above $29 and establish a new range above $29 to make an effective test of the $52-week highs near $30 and the all-time highs going back to 2007 near $31:
Back in late August (Playing the Yield MineField), I had some comments on U.S. banks, largely emanating from the inverted yield curve in the U.S. and the growing trillions of negative-yielding debt around the globe:
Naysayers about Zero Interest Rate Policy (ZIRP) and Quantitative Easing (QE) have been predicting bond market armageddon since these unconventional monetary tools were put in place starting in 2008 during the financial crisis to stave off what might have been the collapse of our banking and insurance sectors here in the U.S. (and then globally). But something strange happened over the last decade, yields never rose materially from the zero interest rate bound, piles of debt that were accumulated by central banks the world over never meaningfully worked down their balance sheets and not surprisingly this has not exactly had the desired impact on global growth. Some might argue that the credit crisis that started here in the U.S in the aughts never really ended, it has merely been migrating around the globe.
Which brings me to bank stocks, which for starters in the U.S., these policies were aggressively were employed to right some of the wrongs by our financial institutions. One of the main reasons for ZIRP & QE was to reflate risk assets and I think it is safe to say that low rates for a decade certainly did do that, but oddly once the underlying institutions were stabilized for the most part the equities of banks globally have sat out the party with the Euro Stoxx Bank Index (SX7E) and Japan’s Topix Bank Index near 30- year lows
Oh, what a difference a month makes. Rates have risen despite the Fed’s second r25 basis point rate cut yesterday in ten years, and bank stock’s the world over are rejoicing from defused tensions (for now) on the trade front. Even the EuroStoxx Banks Index (SX7E) has risen from multi-year lows, up nearly 16%, but possibly encountering resistance at the downtrend from its 2018 high, still down nearly 40% from those levels:
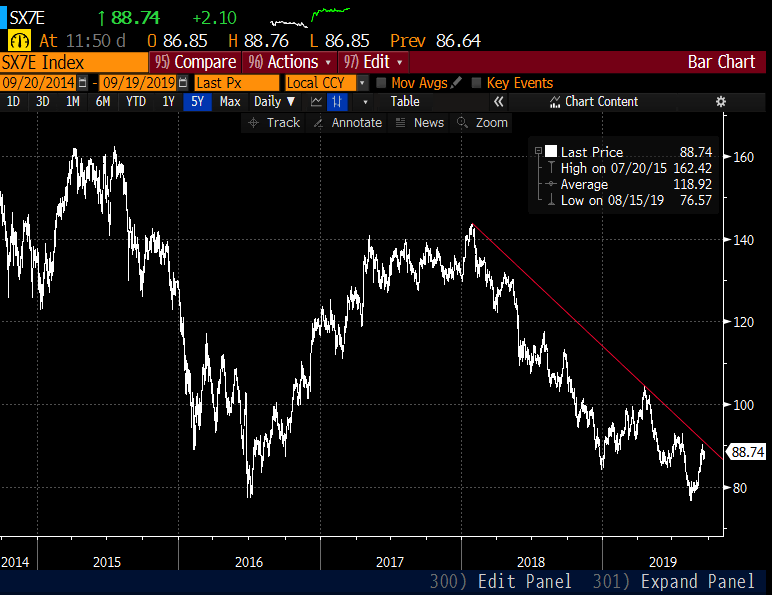
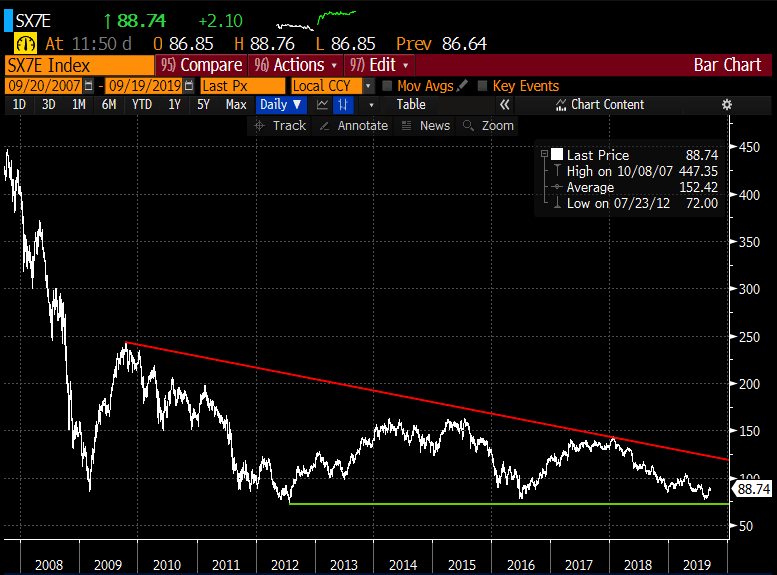
The SX7E is one of the craziest charts in the entire market in my opinion, looking at the ten-year chart u see MASSIVE long-term support in the mid to low $70s, mild near-term resistance near $100 and then nothing really until the downtrend near $120:
But I am nothing if not consistent. JPM picking its head up above 18-month resistance, Eurobanks having a dead cat bounce from near all-time lows and U.S. Treasuries Yields halting their summer death spiral does not exactly convince me that we are about to see a rotation in leadership to bank stocks.
Which brings me to at least one trader’s view that one laggard in the group will make higher highs in the next two months. When Morgan Stanley (MS) was $44.25 minutes after the open a trader bought to open 10,000 Nov 46 calls paying $1.02. These calls break-even up at $47.02 on Nov expiration, up 6.3% from the trading level, very near what some technicians might view as near-term resistance:
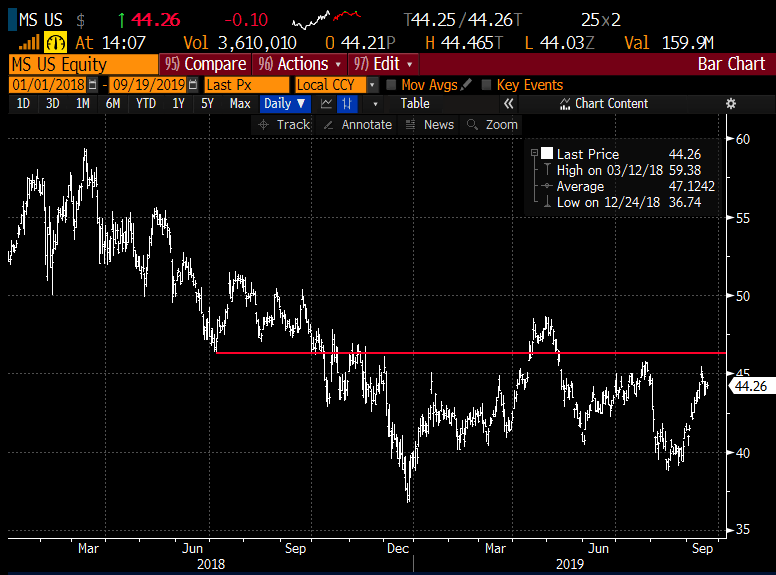
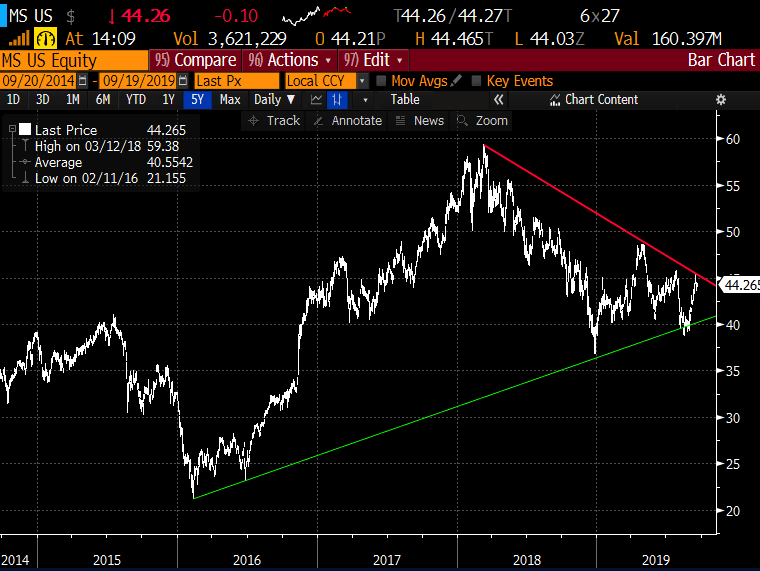
Any way you look at it though, MS is approaching important technical resistance after just bouncing off of very important technical support dating back to early 2016:
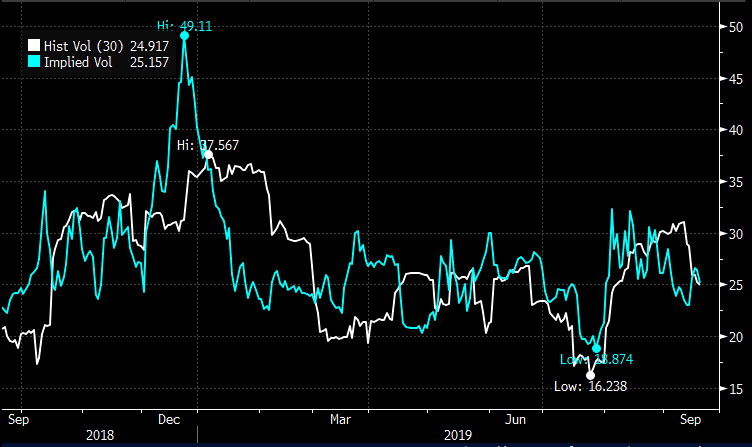
With short-dated options prices relatively cheap with 30-day at the money implied volatility at 30% (blue line below), vs 30-day realized (how much the stock has been moving, the white line below) also at 25%, makes long premium directional trades look attractive at what might be an important technical level (up or down):