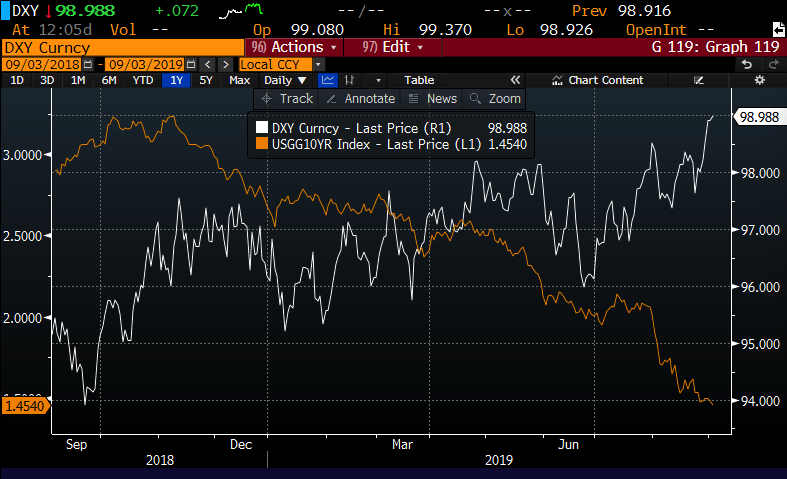
Despite U.S. Treasury yields set to make new cycle lows today, the U.S. dollar (measured by the DXY) is making a more than 2-year high.
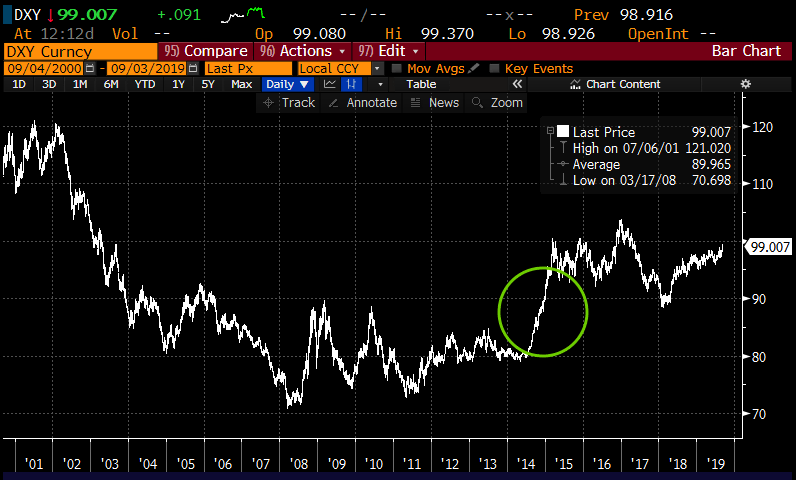
What’s interesting here is that one of the main reasons for the Fed to institute a zero interest rate policy (ZIRP) in the throes of the financial crisis and multiple rounds of quantitative easing in the years after was not only to keep rates low, but also to weaken the dollar vs other currencies around the world that were weak due to the rolling state of the credit crisis. It wasn’t until late 2014 when the Fed ended QE and 2015 when they raised Fed Funds for the first time in years that the Dollar made a meaningful rally:
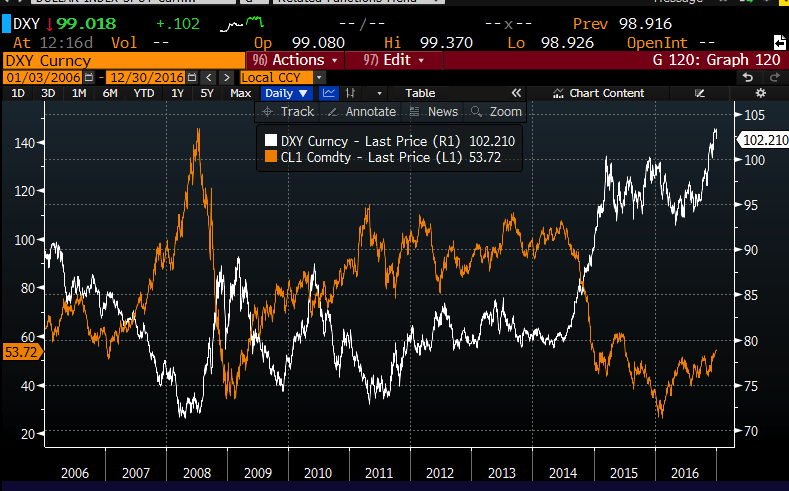
As the reserve currency in the world, a rising dollar has a material affects on lots of assets that are priced in dollars, most notably commodities like Oil. When I overlay the DXY vs Crude from 2006 to the end of 2016 you can see the second half 2008 rally in the DXY corresponded with a nearly 80% peak to trough decline in Crude and then 2014 and 2015 when the DXY rallied from 80 to 100, Crude again dropped nearly 80% peak to trough:
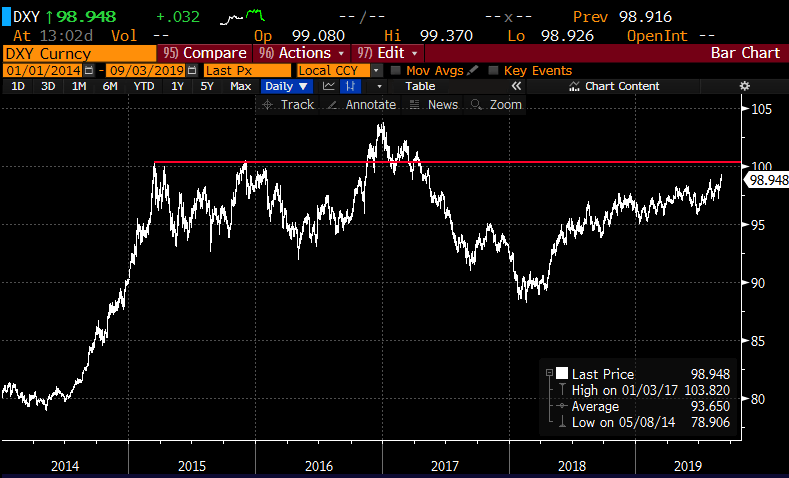
The chart of the DXY since the start of 2014 shows the index approaching a level that found technical resistance at on two occasions in 2015 and then on the heels of the U.S. presidential election, along with almost every U.S. centric risk asset made new cycle highs on anticipation of a growth surge given trump’s supposed pro-growth agenda:
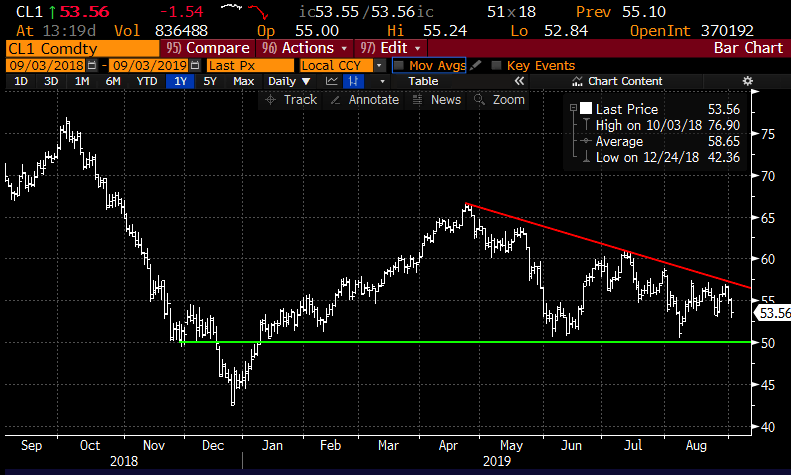
So the question investors have to ask themselves right now is whether or not the Fed will cut interest rates by a quarter or half point at their Sept 18th meeting and if only a quarter will that disappoint investors, causing them to push the U.S. Dollar higher? If that is the case then do we see Crude Oil (which appears to be at a fairly precarious spot on its chart) approaching key technical support near $50 going back to late 2018:
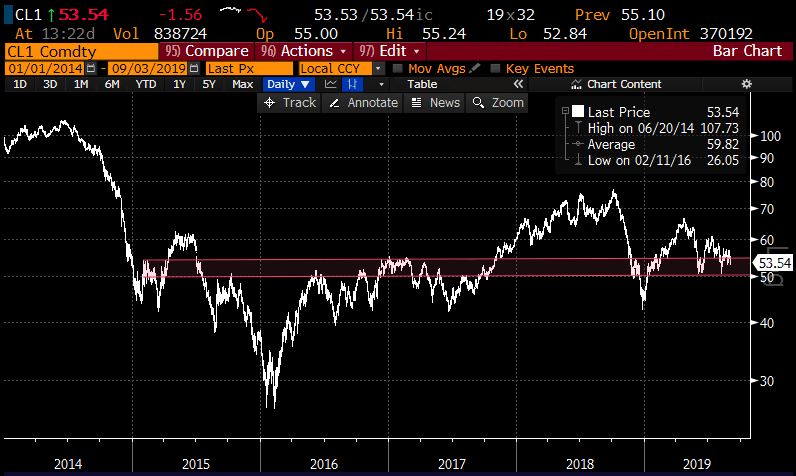
The chart since the start of 2014 shows just how important the support range between $53 and $50 has been:
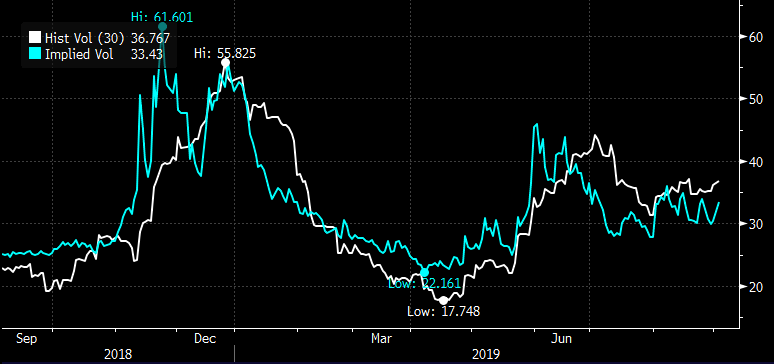
So what’s the set-up? If you think the trade war continues into the new year, the Fed keeps lowering rates, but the DXY merely stays bid in the high $90s then I suspect oil breaks $50 on the headwinds of slowing global growth and the strength of the U.S. Dollar. One way to play this with defined risk could be with puts or put spreads in the U.S. Oil etf, the USO. Short-dated options are cheap relative to the underlying ETF’s movement (30-day realized volatility near 37%, the white line below), despite 30-day at the money implied volatility at 33% (blue line), basically in line with the one-year average:
So what’s the trade?
Buy USO ($11.17) Buy Dec 11 – 9 Put Spread for 55 cents
-Buy to open 1 Dec 11 put for 73 cents
-Sell to open 1 Dec 9 put at 18 cents
Break-even on Dec expiration:
Profits of up to 1.45 between 10.45 and 9 with max gain of 1.45 at 9 or lower
Losses of up to 55 cents between 10.45 and 11 with max loss of 55 above 11
Rationale: options prices are not exactly cheap on an outright basis, this put spread offers a break-even down 6.3% with a max profit of up to 13% if the etf is down 19% on December expiration. Make no mistake, this trade idea would only make sense for someone who was looking to play for a massive breakdown in the coming months.