Regular readers of RiskReversal and viewers of CNBC’s Fast Money and Options Action programs are likely very aware of a simple fact about me when it comes to financial markets, I am just a stock and options monkey… not an economist, or fixed-income expert, or have some unusually complex understanding of commodities and macro events. Just stocks and options that trade with them. But every so often the quest of finding some cheap vol in the options market leads me to commodity or fixed income linked equity etfs. As far as rates have been concerned I have a couple of pretty good stabs at the TLT on the long side, the iShares 20-year Treasury etf over the last year (read here) which is causing me to go a little farther afield, today looking at the HYG, the iShares High Yield Corporate Bond etf. But again, a little outside of my wheelhouse, but like you, I like to be an active participant in my education.
Today on Bloomberg I read an article titled: History, Macro Factors Point to Wider Spreads for Junk Debt
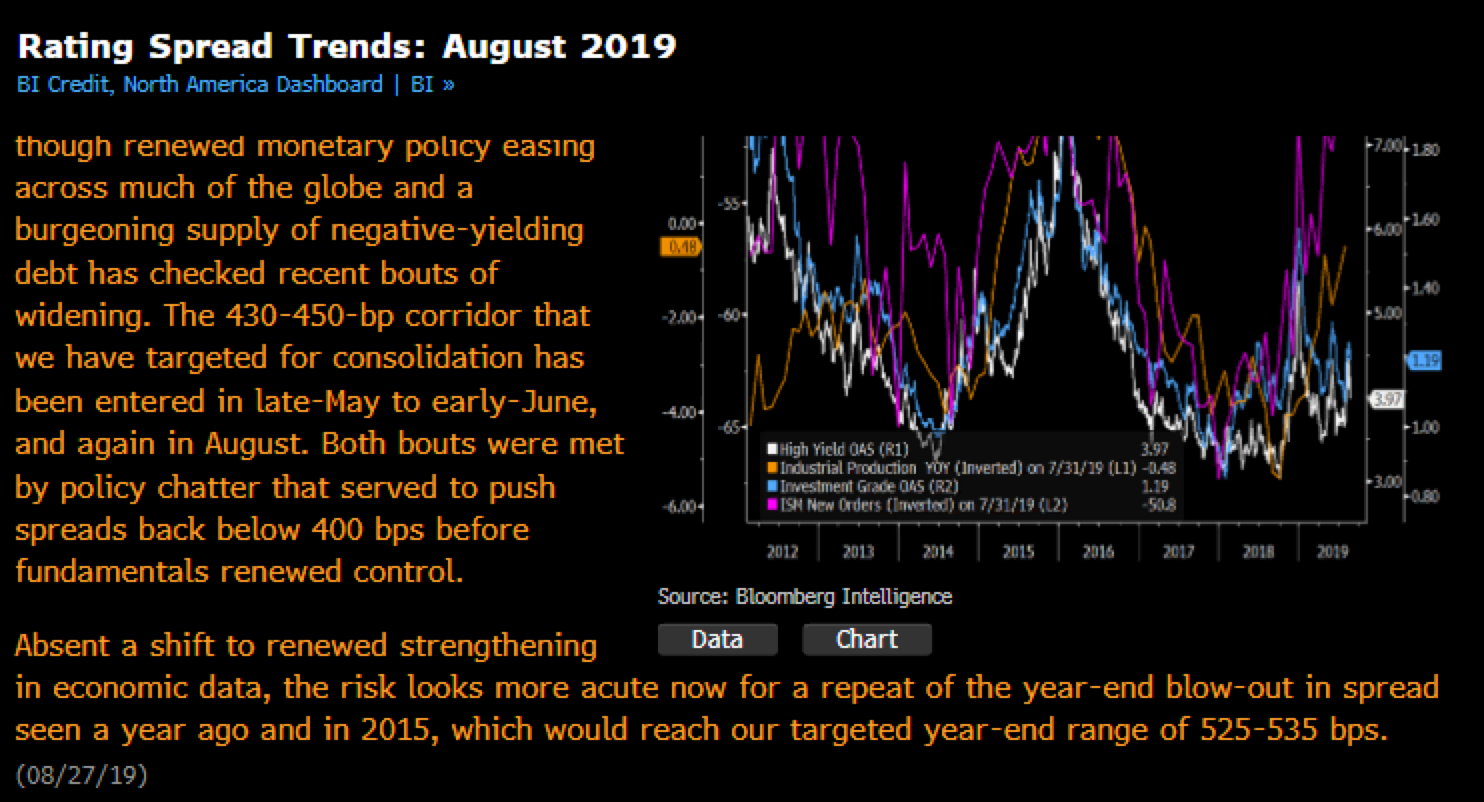
It was the last bit that caught my attention ” absent a shift to renewed strengthening in economic data… ” yeah well good luck with that, as long as our president has weaponized tariffs and “hereby declares them” via Twitter.
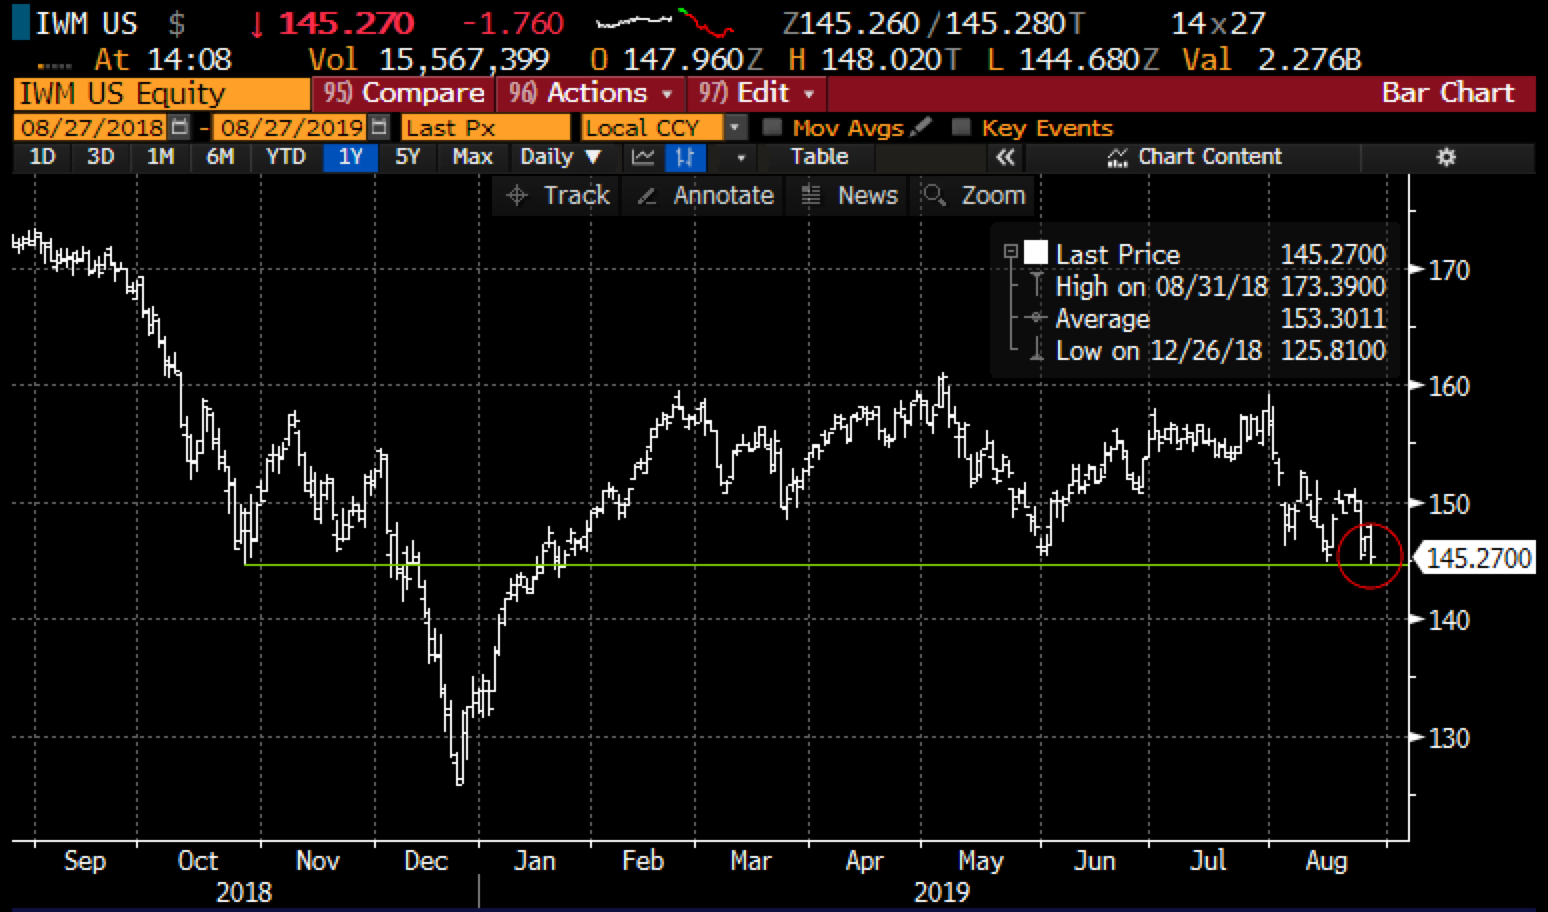
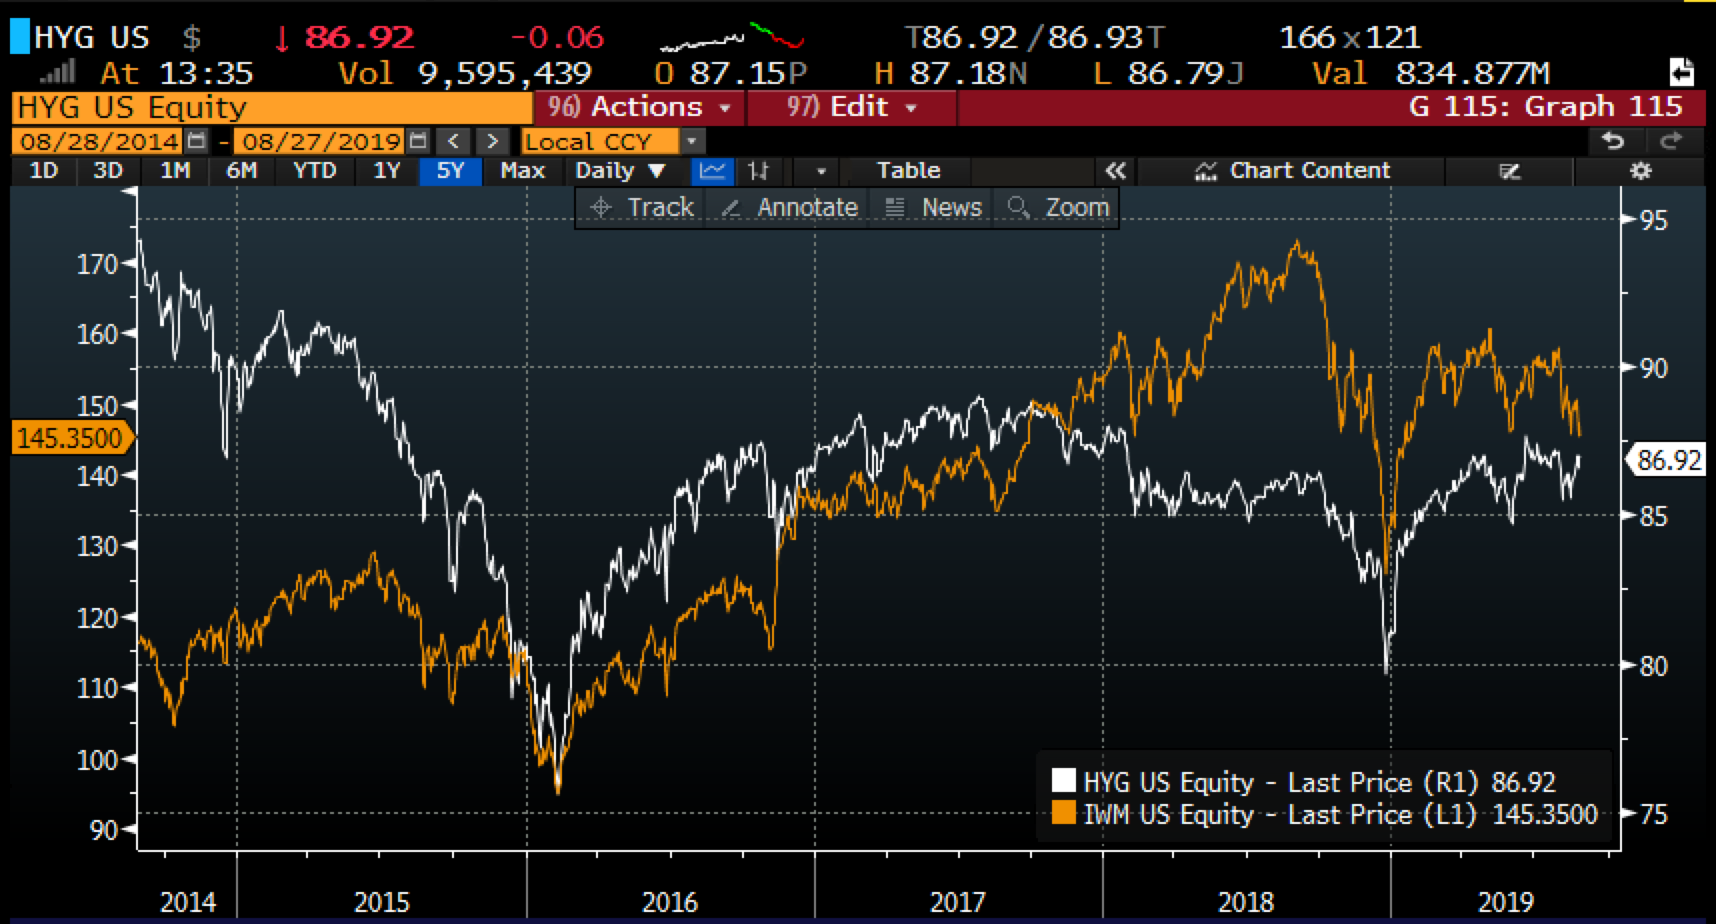
Which leads me to the Russell 2000, or the IWM etf in particular which tracks the index of small-cap stocks, breaking $145 for the second time in a week (briefly) to the downside since late January, at a key near-term technical support level, and down 16% from its all-time highs made last summer:
Why look at small caps? well as a recent MarketWatch.com article put it, quoting Bank of America on the earnings outlook for the group:
companies in the index appear mired in an earnings recession, after profits fell by double digits in the first quarter and look set to fall by 9% in the second, according to Bank of America.
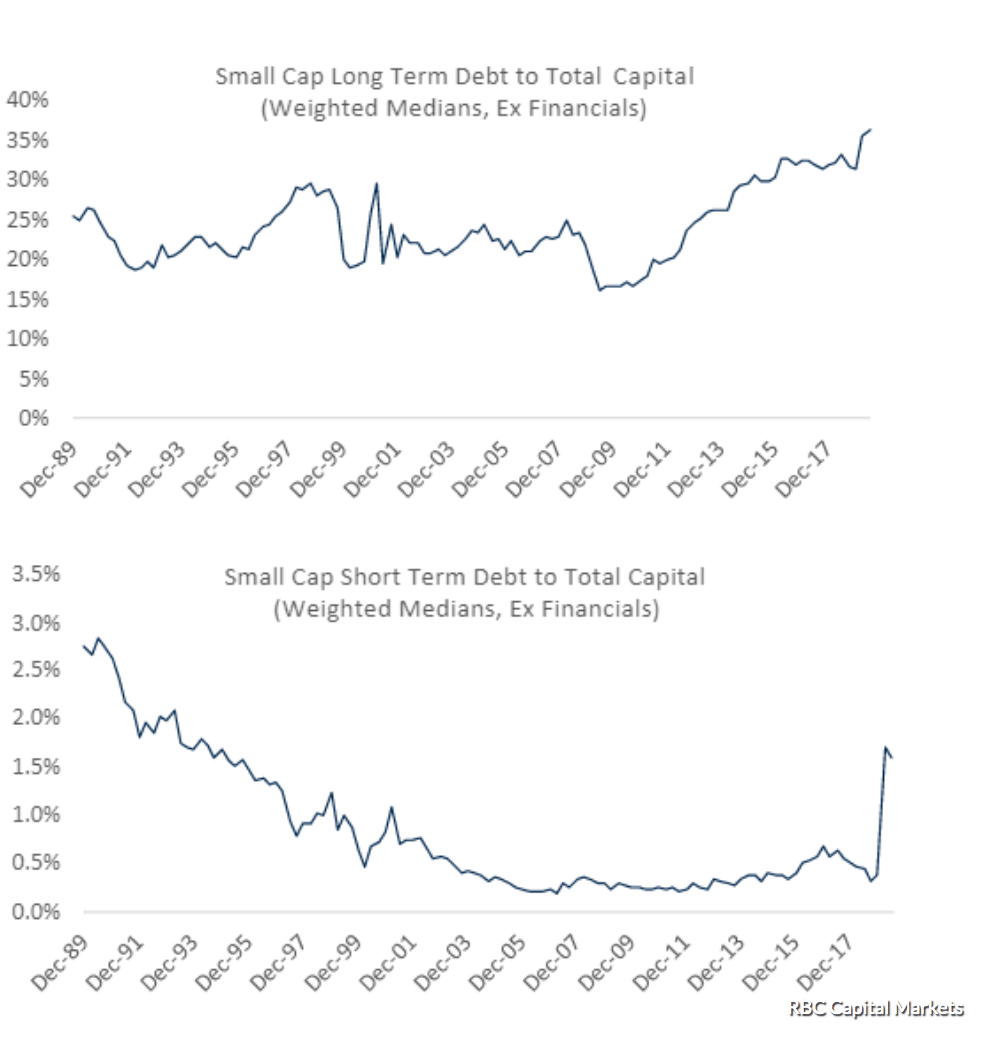
The article went on to quote analysis by RBC’s Head of U.S. Equity Strategy, Lori Calvasina regarding her concern for rising debt levels for the small-cap index, reaching all-time highs:
“net debt to cap for the Russell 2000 has been near past peaks in recent years, due to a sharp escalation in long-term debt.”
So connecting the dots, the article goes on (emphasis mine):
Victor Cunningham, small-cap portfolio manager at Third Avenue Management says that this rising debt is a red flag that is masking even worse performance among small-cap companies than even the dismal earnings performance for Russell 2000 companies this year suggests.
…
if the economy enters a significant downturn, much of this debt could become a serious problem as earnings fall and interest rate expense rises in relation. But it could also be a problem if the economy rebounds and interest rates rise. “Given the size and nature of small caps, they have fewer credit options and less diversified businesses.”
From where I sit, I suspect this sort of narrative will get amplified if small-cap stocks continue to under-perform their large-cap brethren if the stock market as a whole continues lower in the coming months and if plunging global yields start to worry holders of risk assets and shake their will as we saw in Q4 2018, Q1 2016 and Q3 2015.
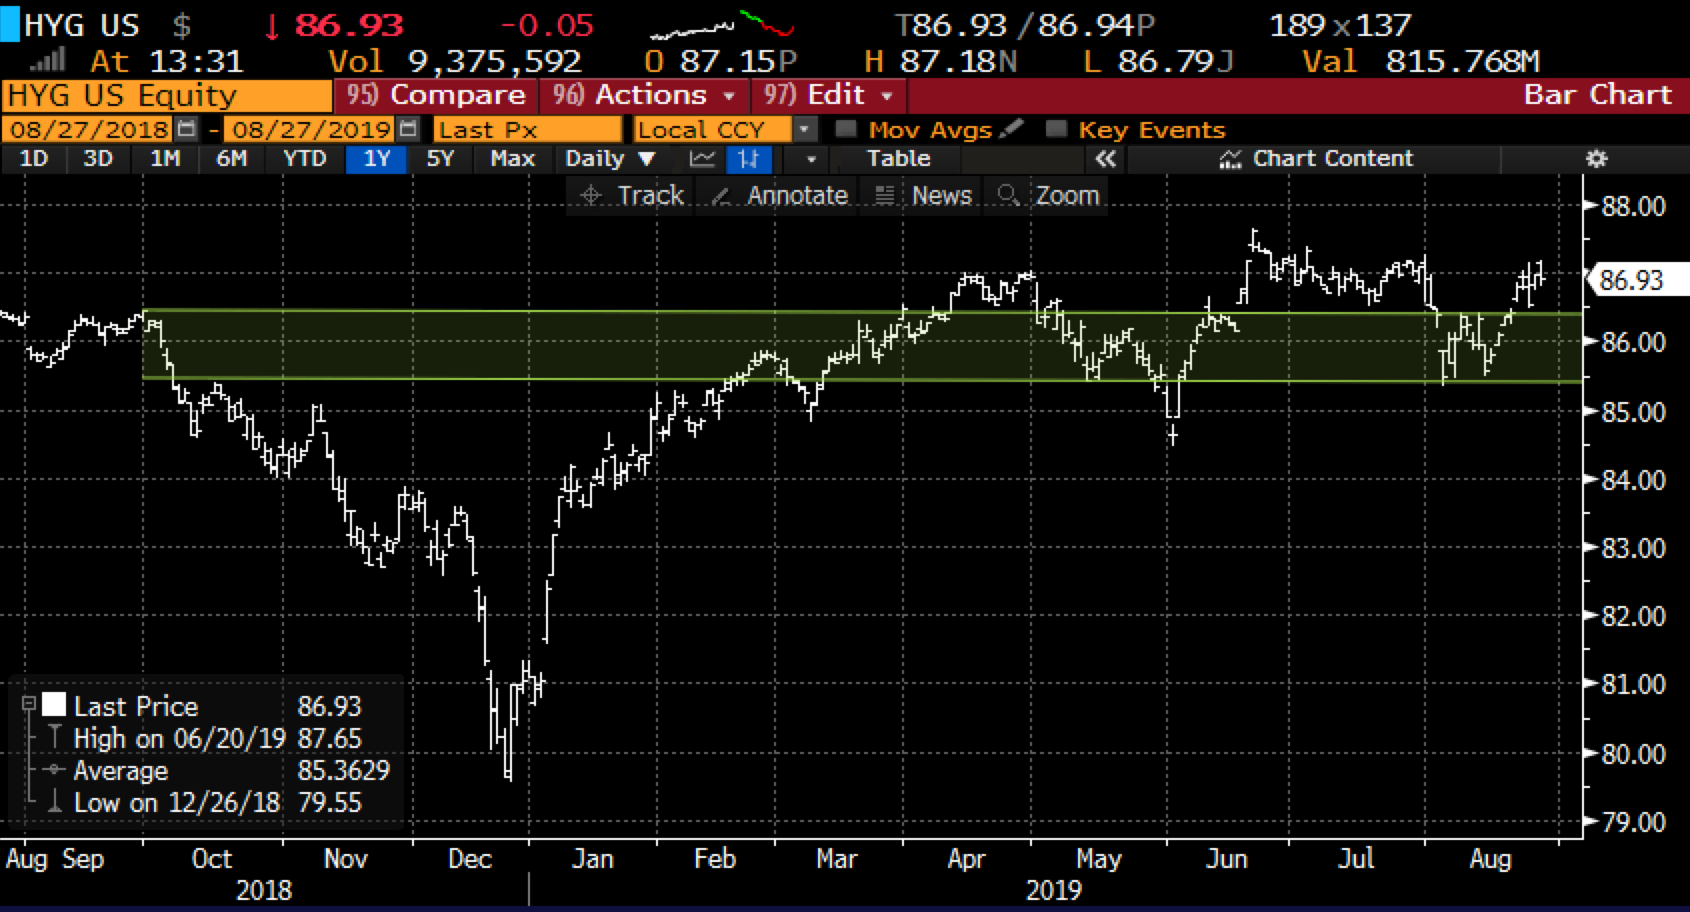
But the 1-year chart of HYG shows NO stress, it actually looks quite constructive with healthy support between $85 and $86:
But it is worth noting that sharp declines in the IWM have yielded sharp declines in the HYG over the last 5-years, with this summer as a bit of a divergence:
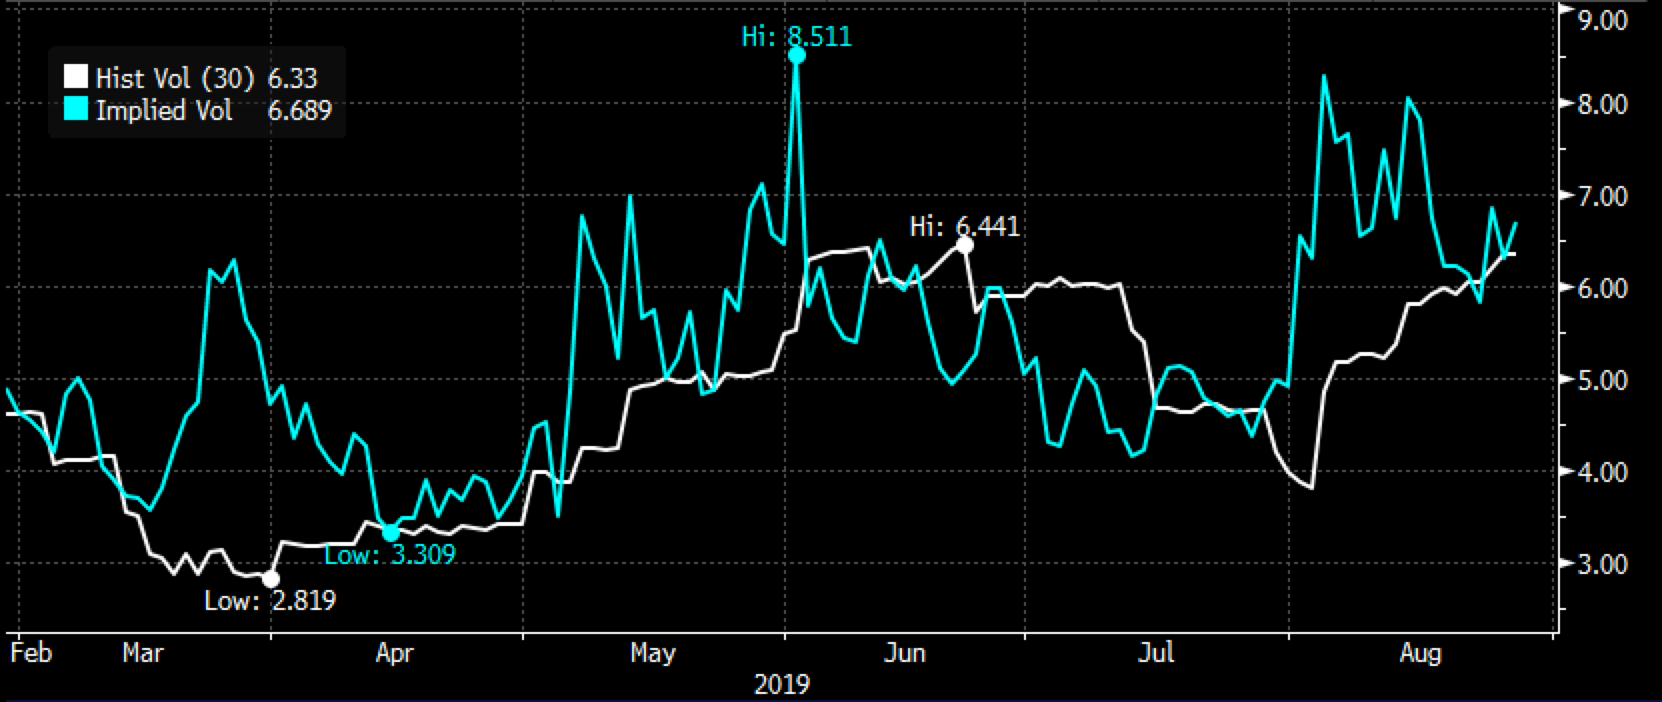
Despite the relative strength of the HYG in the face of inverted yields, slowing growth and a relatively weak small-cap index, short-dated options prices on the etf is cheap as chips with 30-day at the money implied volatility at just under 7%, implying less than 1% daily moves, especially when you consider that 30-day realized volatility, how much the etf has been moving is picking up (white line below), just below realized… suggesting relative cheapness to options prices:
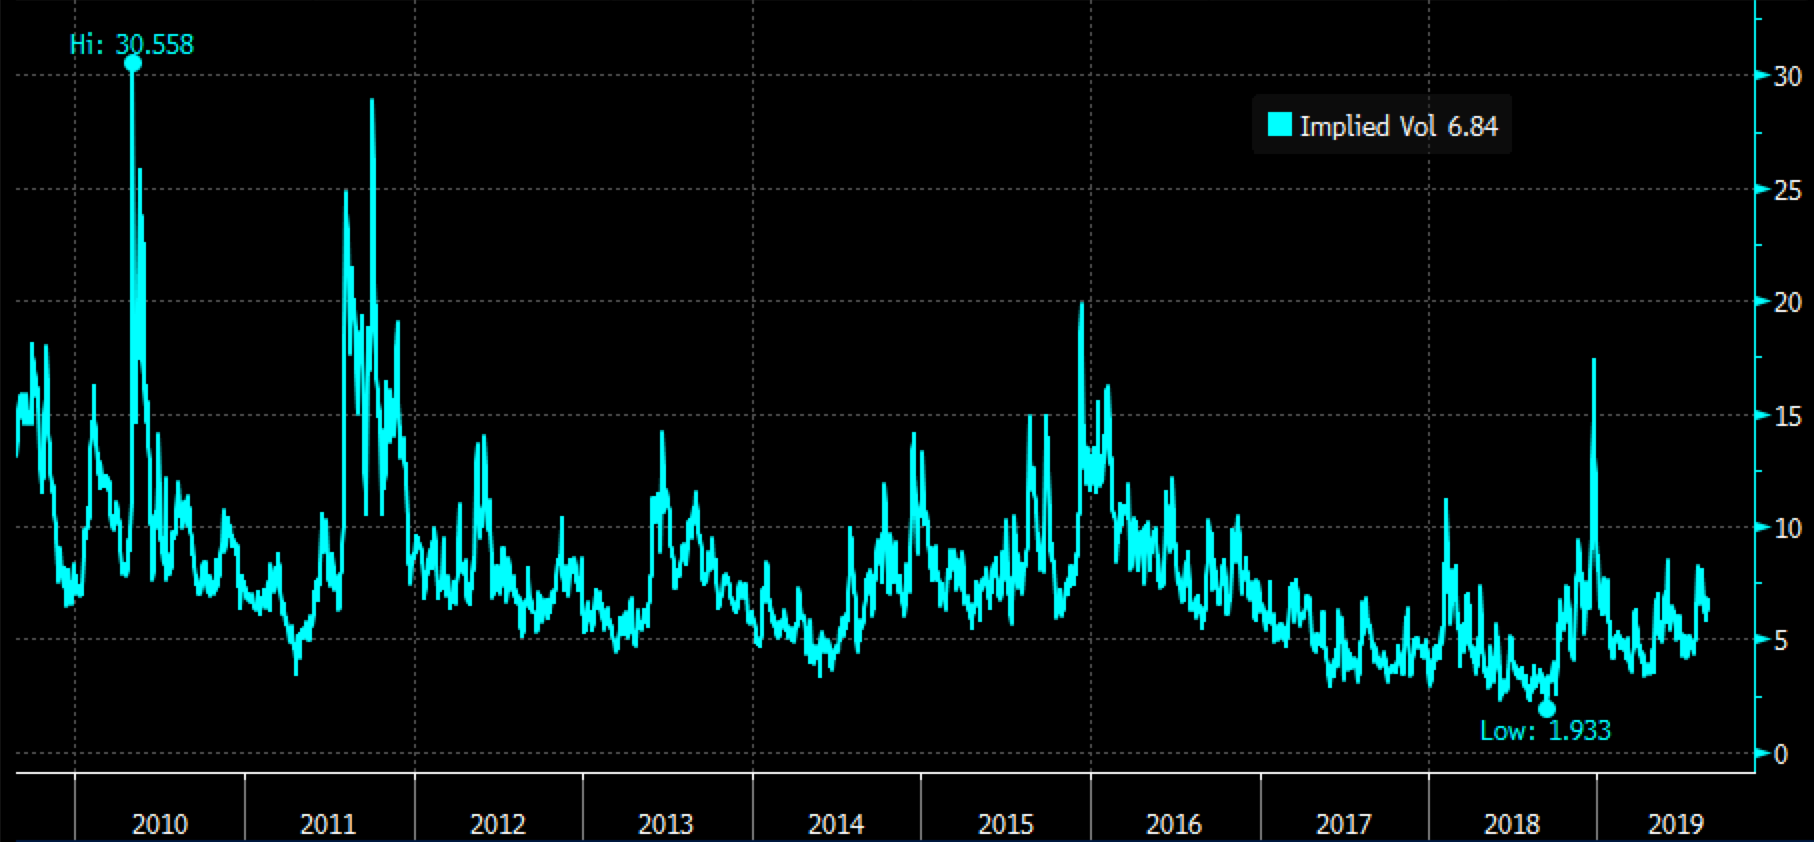
The ten-year chart below of 30-day at the money implied volatility shows the almost annual spikes above 10% which usually occur during corrections int he equity market as we had in 2018, 2015/16, 2011 and 2010:
So what’s the trade? If you think as I do that the risk assets are just starting to feel the heat from plunging yields, likely the result of quickly weakening global growth and central bankers left with few traditional options to combat weakening financial conditions, then high yield debt index’s like the HYG will not be immune to pressure.
Bearish Trade Idea: HYG ($86.95) Buy Nov 86 – 80 put spread for $1
-Buy to open 1 Nov 86 put for $1.28
-Sell to open 1 Nov 80 put at 28 cents
Break-even on Nov expiration:
Profits of up to 5 between 85 and 80 with a max gain of 5 at 80 or below
Losses of up to 1 between 85 and 86 with max loss of 1 above 86
Rationale: this trade idea breaks-even down 2.3% and offers a max payout down 8% in 3 months if the ETF is at or near the December lows.