In less than a year, global sovereign debt with negative yields has gone from $6 trillion to just over $16 trillion with little signs of this trend abating, as the Financial Times noted last week:
“as the global economy feels a squeeze on manufacturing and forlornly waits for signs of a genuine truce in the US-China trade war, bond prices, for now, reflect expectations of weaker growth and the hope that central banks will repeat their previous doses of extraordinary monetary policy”
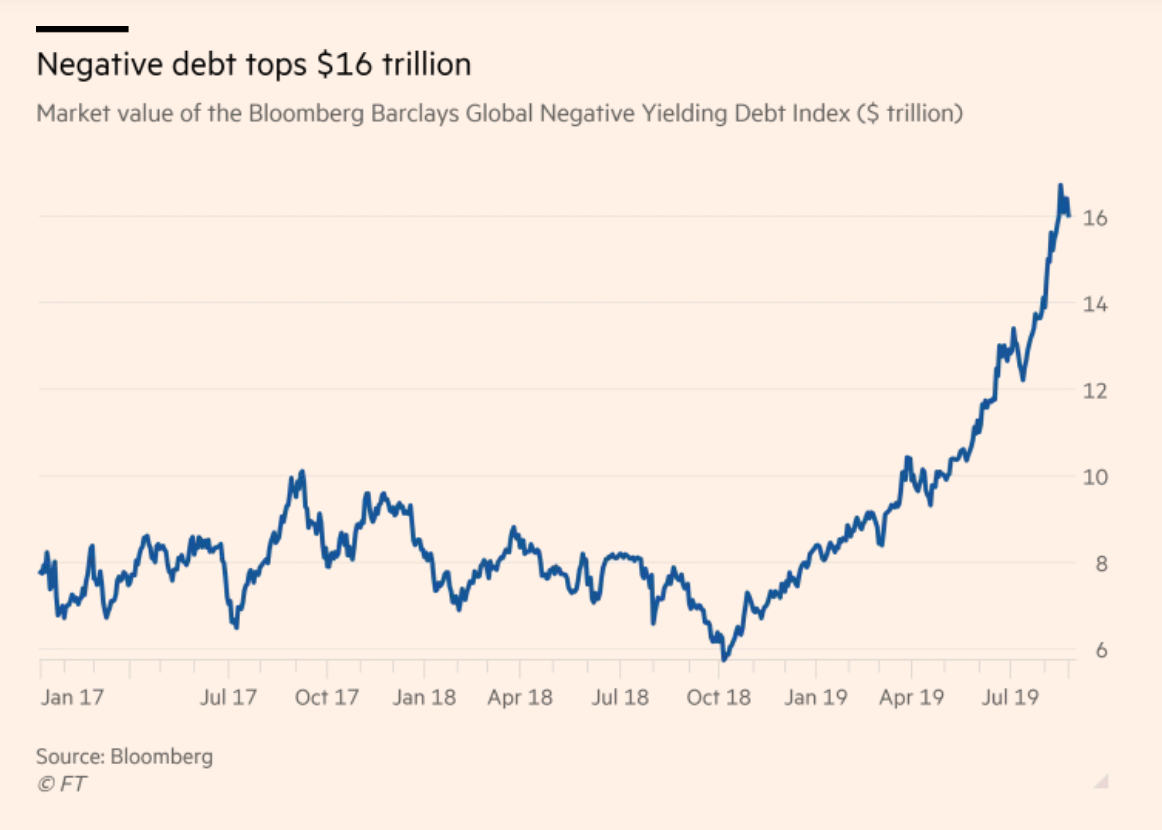
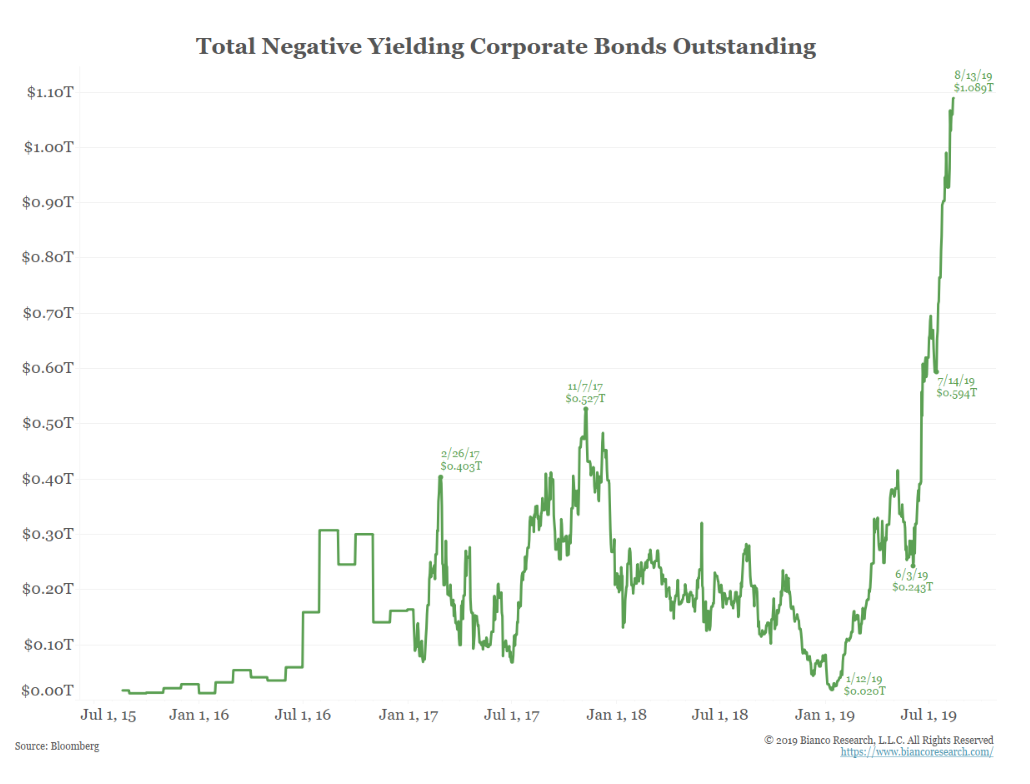
What’s interesting to me about this chart is those holders of this debt have seen very nice price appreciation while stocks, thought to be the major beneficiary of low yields have gone NOWHERE. The parade of lower yields, and below the zero interest bound has been a massive momentum trade, but also a flight to perceived quality as investors see the lower yields as a sign of weakness in the global economy and the prospects of increasingly dovish global central banks will only accelerate this race to lower than zero thus creating an insane feedback loop. And its not just in sovereign debt, as Jim Bianco of Bianco Research recently remarked:
Negative-yielding corporate debt, though, is a relatively new thing, rising from just $20 billion in January to pass the $1 trillion mark recently
…
“The interest rate risk that these bonds carry is huge,”
“The financial system doesn’t work with negative rates. If the economy recovers, the losses that investors would take are unlike anything they’ve ever seen.”
Naysayers about Zero Interest Rate Policy (ZIRP) and Quantitative Easing (QE) have been predicting bond market armageddon since these unconventional monetary tools were put in place starting in 2008 during the financial crisis to stave off what might have been the collapse of our banking and insurance sectors here in the U.S. (and then globally). But something strange happened over the last decade, yields never rose materially from the zero interest rate bound, piles of debt that were accumulated by central banks the world over never meaningfully worked down their balance sheets and not surprisingly this has not exactly had the desired impact on global growth. Some might argue that the credit crisis that started here in the U.S in the aughts never really ended, it has merely been migrating around the globe.
Which brings me to bank stocks, which for starters in the U.S., these policies were aggressively were employed to right some of the wrongs by our financial institutions. One of the main reasons for ZIRP & QE was to reflate risk assets and I think it is safe to say that low rates for a decade certainly did do that, but oddly once the underlying institutions were stabilized for the most part the equities of banks globally have sat out the party with the Euro Stoxx Bank Index (SX7E) and Japan’s Topix Bank Index near 30- year lows:
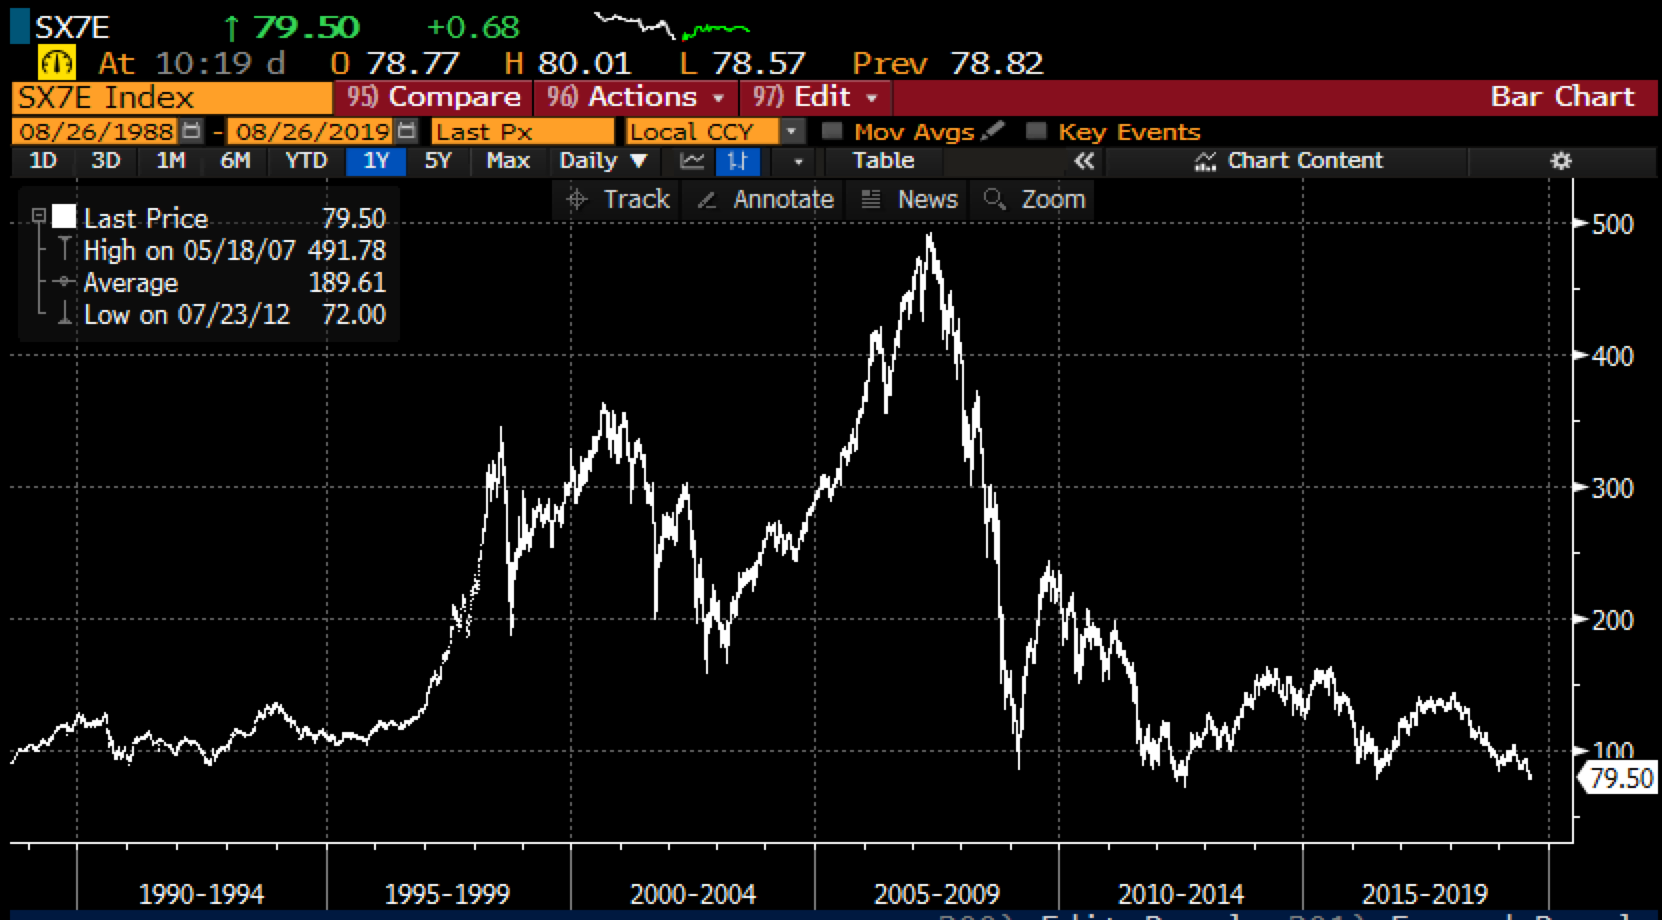
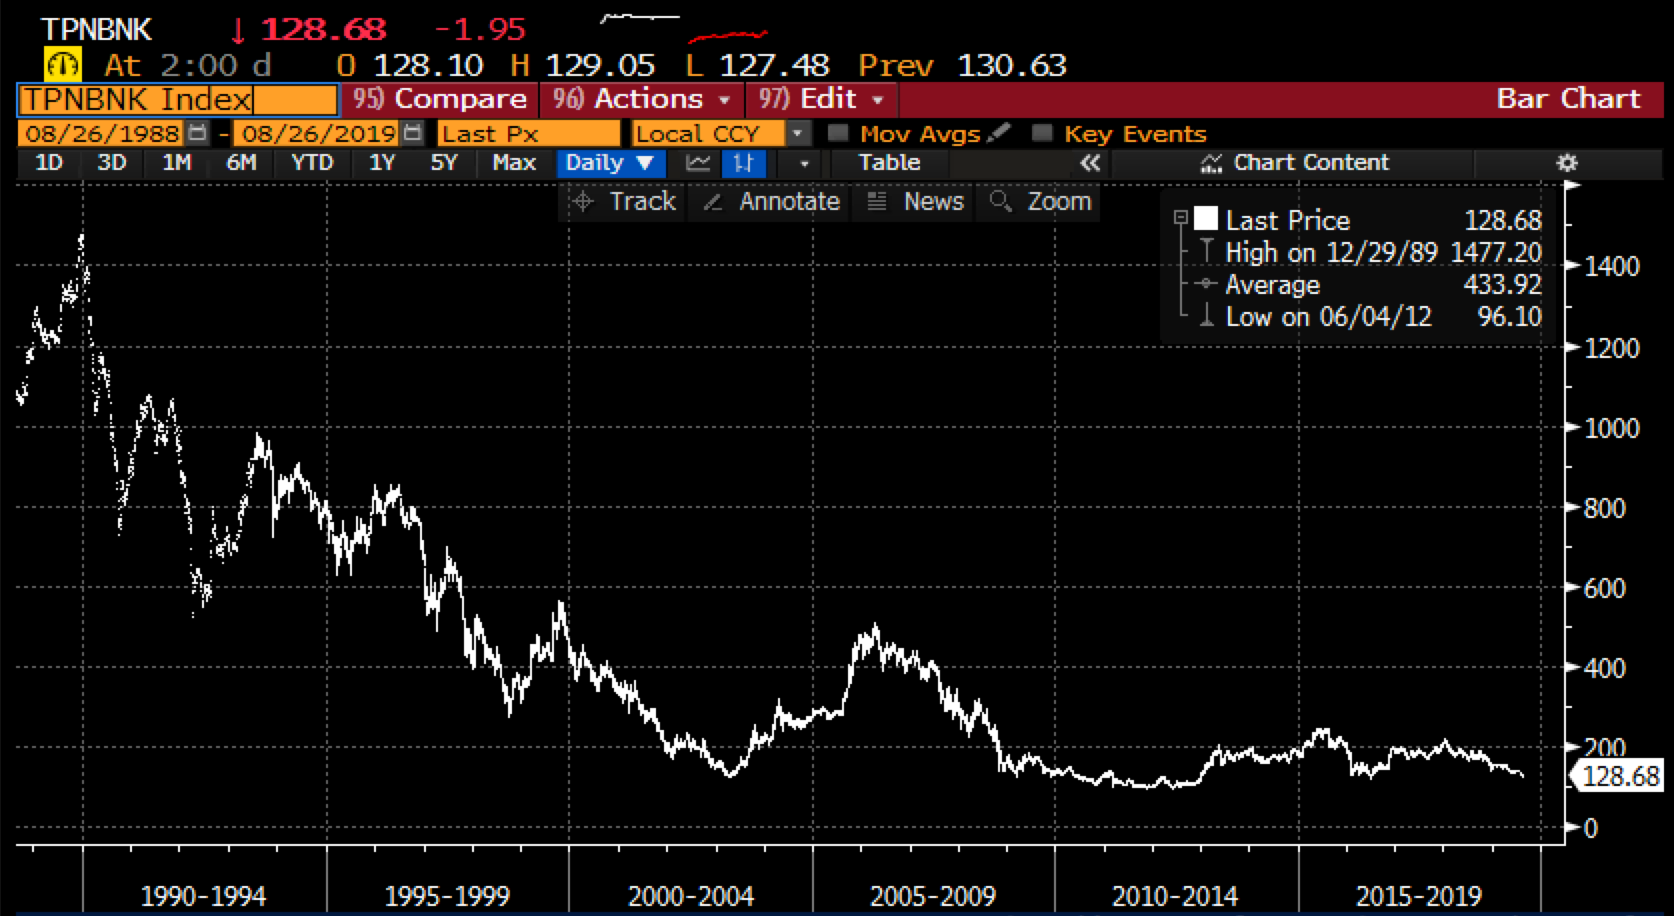
If banks are the lifeblood of healthy economies and their equities reflect investor optimism about the profitability of their activities within future economies than a takeaway from European and Japanese banks stocks is fairly simple… too easy monetary policy for too long is not too good for bank stock’s valuations.
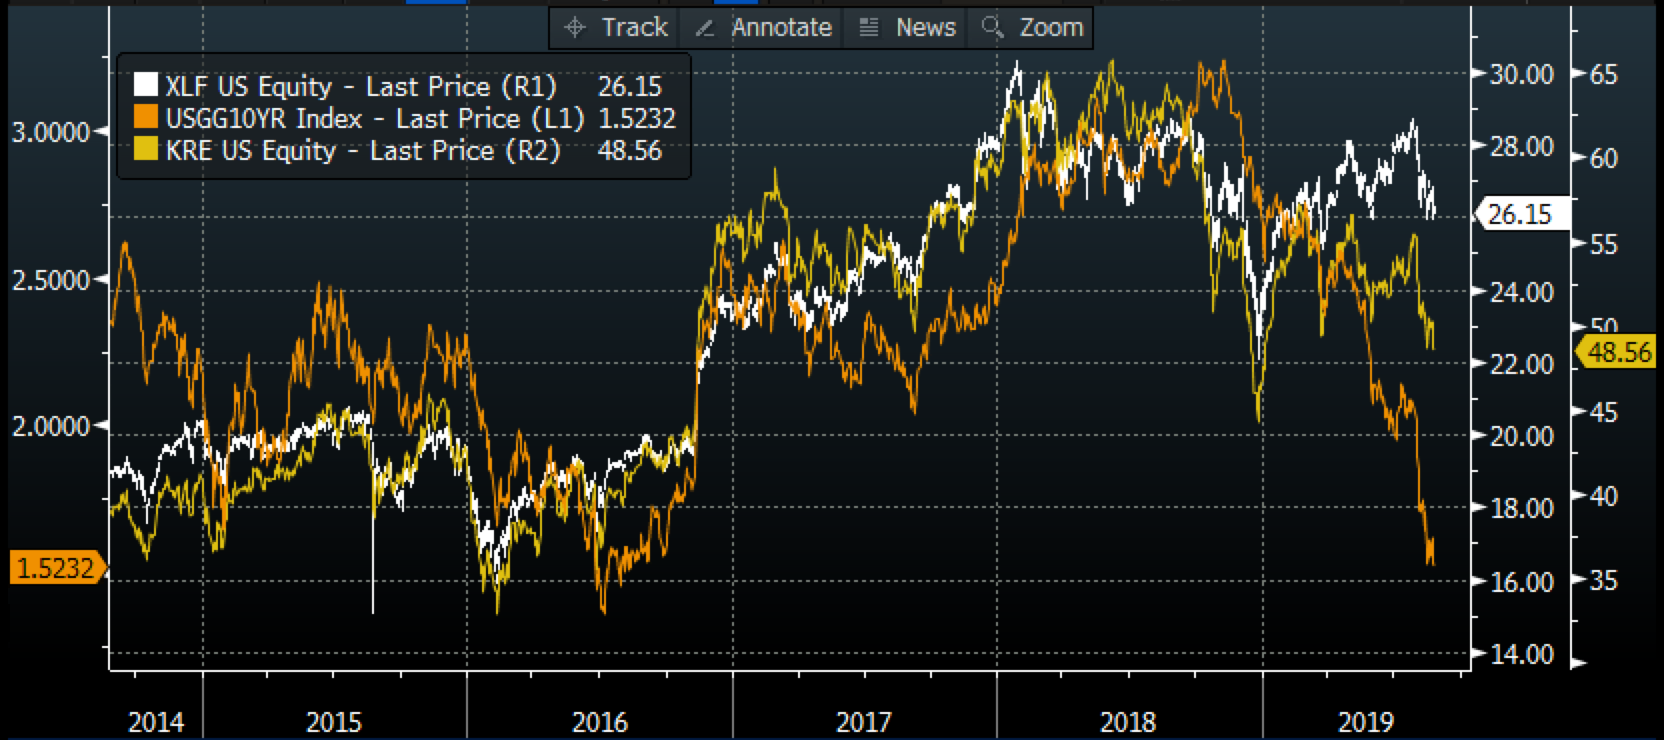
Which leads me to the U.S. since our central bank planned to exit QE and end ZIRP in 2014 and 2015, bank stocks rose with the yield on our 10-year Treasury, first in 2014 and then again into last year’s cycle high above 3%…. since then with the 10-year yield being cut in half from last fall, regional banks, measured by the KRE have fallen sharply and now the XLF, the ETF that tracks mega-cap U.S. banks have started to turn in sympathy with yields:
As for U.S. banks, it is hard to start a conversation without speaking of J.P. Morgan (JPM) the darling of the group and the largest by market cap. While JPM is considered best of breed, reflected by its valuation relative to its moneycenter peers, the stock has failed to confirm a single new high in the SPX since early 2018 and early this month broken the uptrend that has been in place from the December lows:
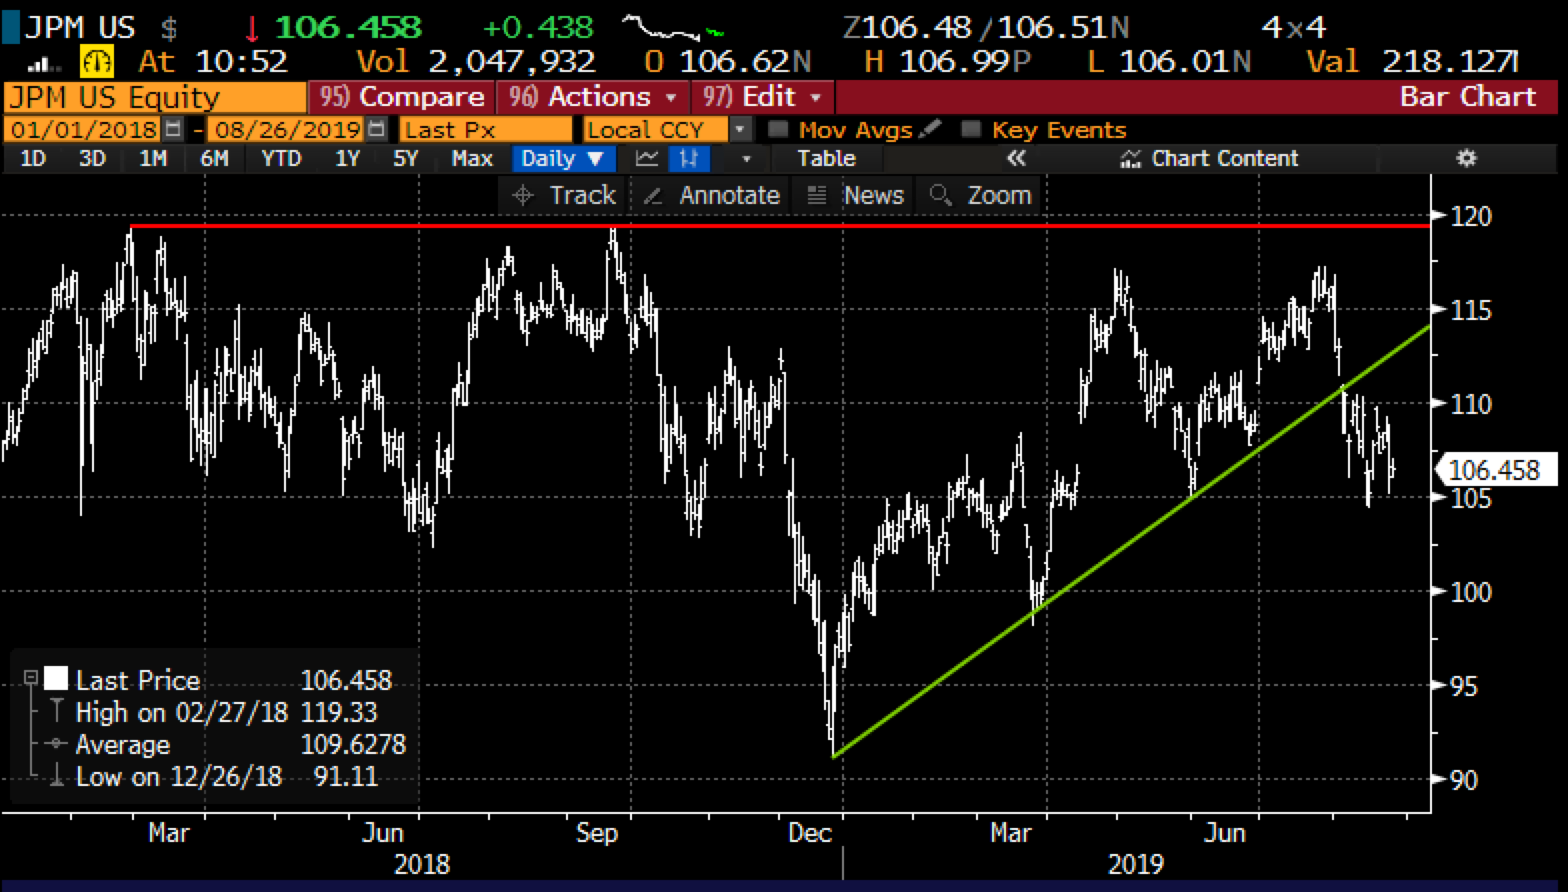
JPM is obviously rangebound spending most of the last year and a half between $100 and $115 with massive technical resistance just below $120 with psychological support first at $100 and then above $90 at the 2018 lows. As far as near-term technical resistance, the uptrend that was once support now becomes resistance.
The XLF whose top 5 holdings (Berkshire Hathaway, JPM, Bank of America, Wells Fargo and Citigroup) make up 40% of the weight of the etf has a similar look and feel to JPM, but is hovering above near-term support at $26 and is below its uptrend from the Dec lows:
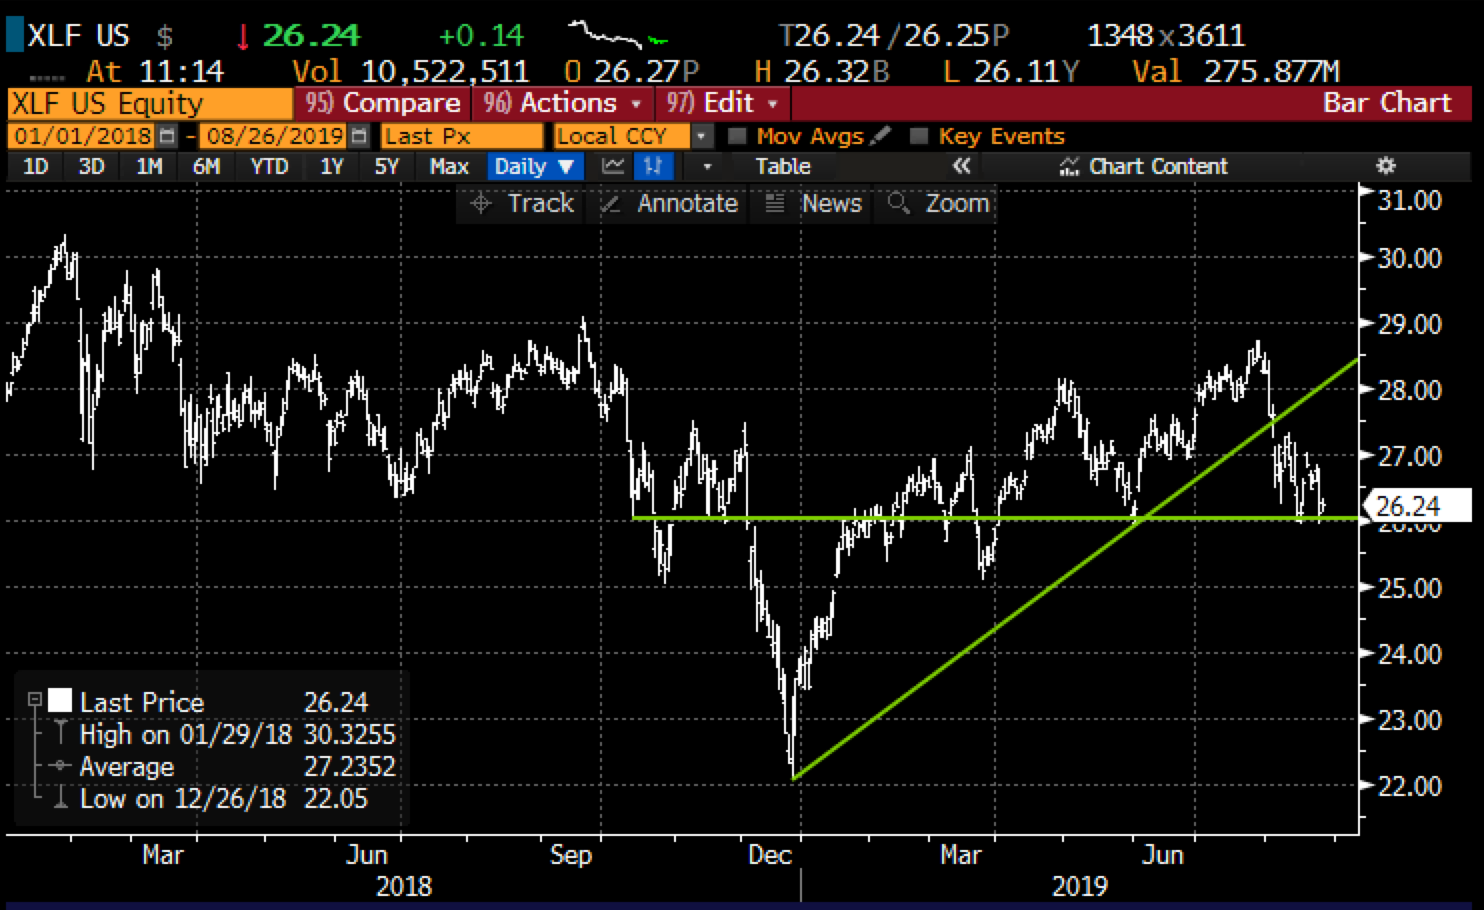
The group is barely rallying today on bs headlines from trump about trade progress with China. I suspect the drumbeat for lower global yields is the primary force determining the trajectory of U.S. bank stocks these days, and if global banks are any indication, playing for a break of recent support here in the U.S. makes sense.
So what’s the trade? If I were inclined to make a bearish bet on U.S. banks via the XLF I would target Oct expiration, aside from the Fed Meeting on Sept 18th where the only question about a rate cut will be whether it is a quarter-point or a half, Oct will catch at least 50% of the weight of the XLF’s components Q3 earnings and all of the shenanigans from the increasingly stupid trade war.
I’d consider two trades, either an outright put purchase or a put spread. If you thought the XLF would break below $26 soon then I would buy the Oct 26 put for 80 cents (ETF price $26.20) and look to spread by selling the Oct 23 put for at least 30 cents (currently 18 cents), then creating a 26/23 put spread for 50 cents with a 5 to 1 payout in the event the XLF is 23 or lower on Oct expiration.
Or if you thought it might take some time to break, then consider the Oct 26/24 put spread for 50 cents. This trade risks less than 2% of the ETF price, offers a 3 to 1 potential payout if the ETF is down 8.4% in a little less than two months with no shortage of catalysts.