Last week when the S&P 500 (SPX) was 2925 (Playing Stock Market), down about 100 points from the all-time high made just weeks earlier, I took a look at the technical set up in the index considering what is likely to be continued uncertainty surrounding central bank interest rate policy, the new obsession with an inverted yield curve, the potential for recession and of course the impact of the growing trade war on global growth. I concluded that in the near term, the global economy and our markets fate are in the hands of a very unstable individual’s twitter account:
regular readers know where I stand on trump’s negotiating tactics and his deal-making abilities, to be polite he is not what he says he is, and while he can push around public opinion on no shortage of issues via his Twitter account, there are only so many tweets in his quiver that will ultimately be able to prop up the stock market, he is not President for life as XI is, or control their central bank and currency the way XI does, trump’s tariffs are unpopular with his own party and his tactics are likely the main headwind to the “pro-growth” policies that got markets going higher in 2017. Since Jan 2018 the SPX has made little progress up about 70 points or less than 3% and the shocks are clearly to the downside.
And I detailed a trading strategy in SPY options for those looking to protect a portfolio or make an outright bearish bet:
SO what’s the trade? I suspect the commentary about trade will continue to ebb and flow… can the SPX go back and test the upper band of the uptrend that connects the highs? sure, but I suspect any re-test without a substantive trade deal (and I don’t just mean one that focuses on our trade deficit) will be a sell on the news.
If I were inclined to play for a pullback in the SPX in the coming months I might target a break of 2800 with the index heading back towards the Nov 2018 lows that ultimately broke in Dec near 2600 and use puts spreads in the SPY to define my risk.
BEARISH TRADE IDEA: SPY ($293) BUY OCT 290 – 263 PUT SPREAD FOR $5
-Buy to open 1 Oct 290 put for $7-Sell to open 1 Oct 263 put at $2
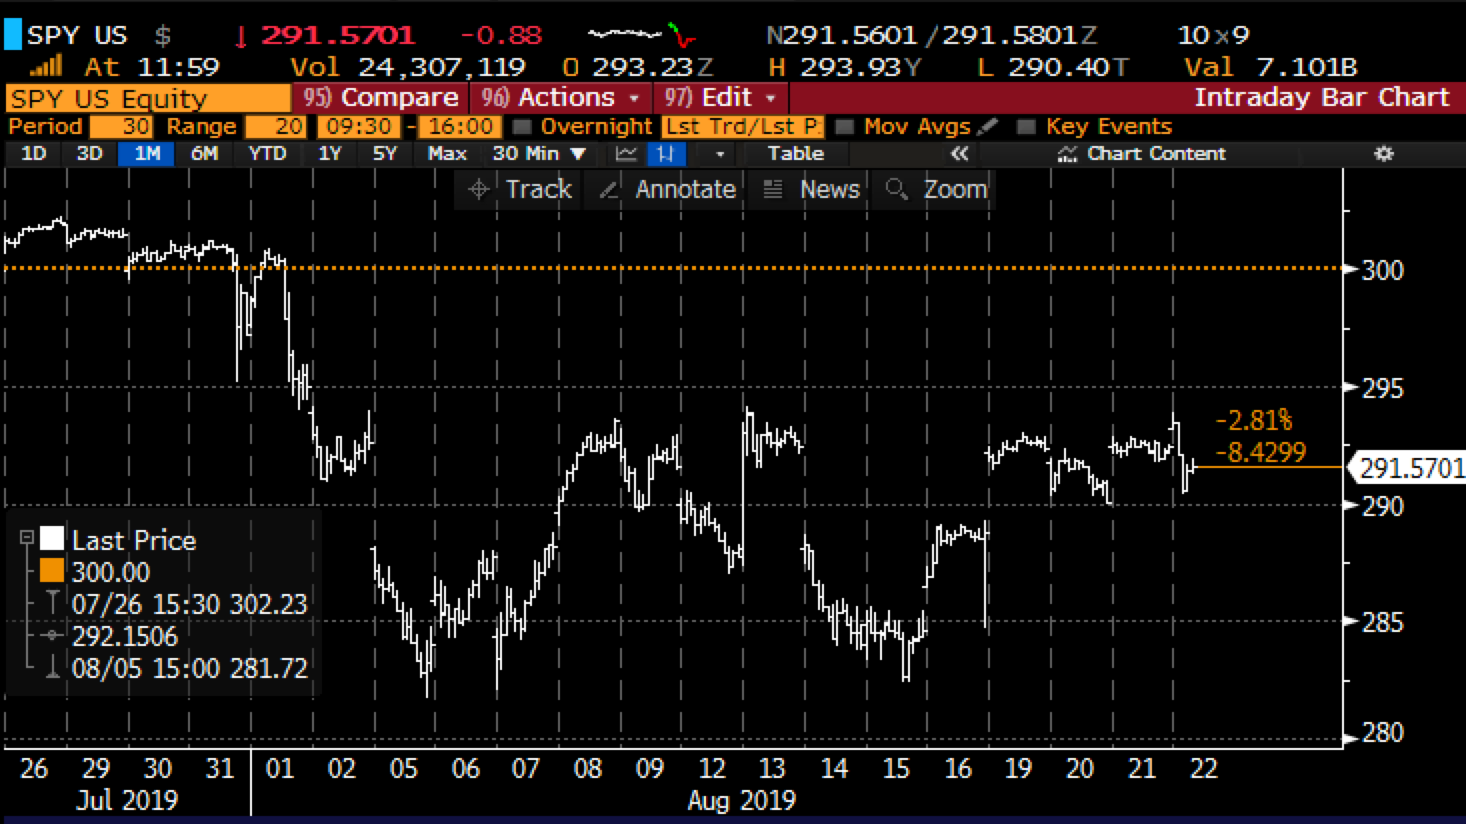
Since the early August drop on trump’s tweets about new tariffs on Chinese goods, and the subsequent push out of threatened tariffs, the SPY has found support on three occasions near $283:
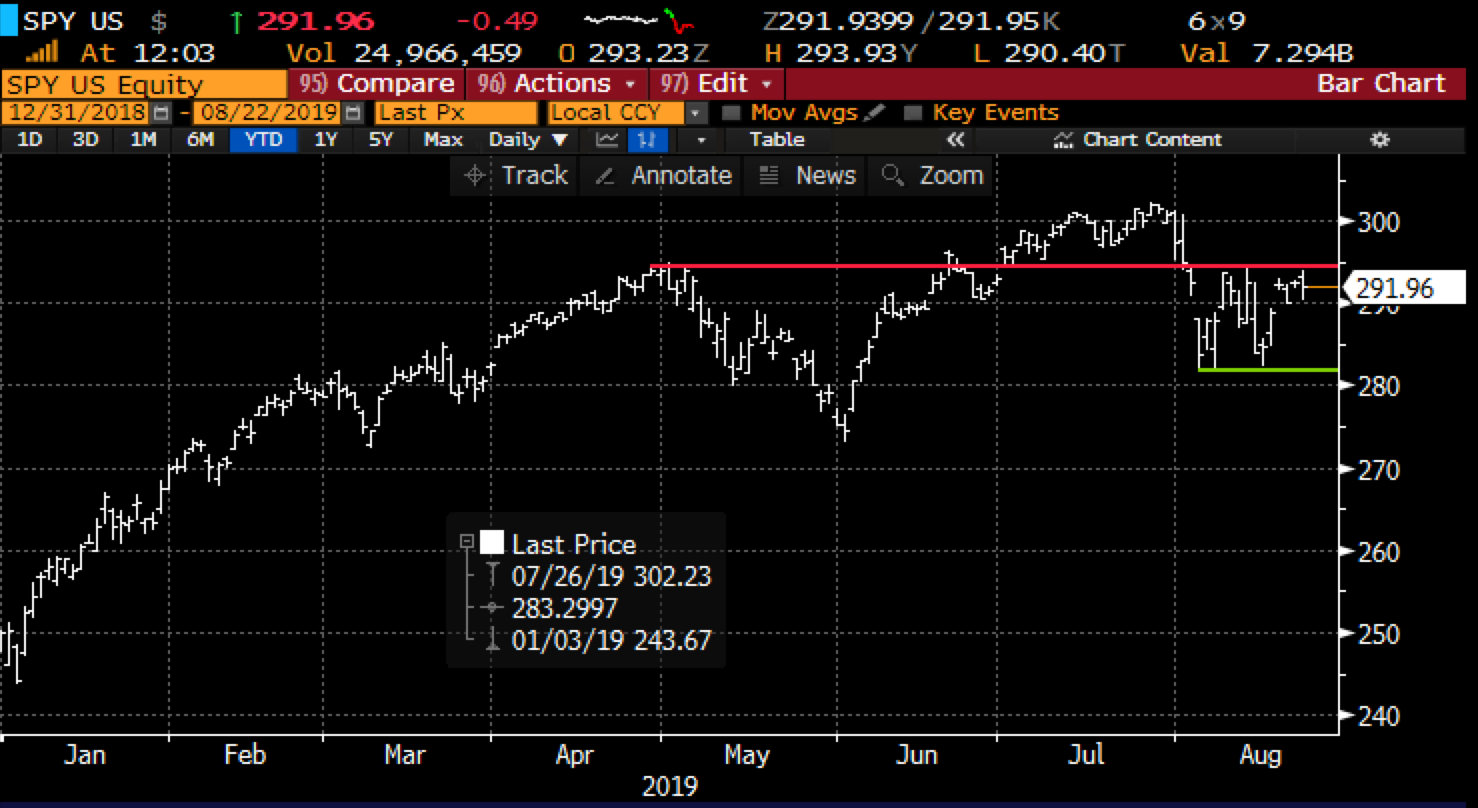
Interestingly, when looking at the year to date chart you can also see that the technical resistance that has been in place around $294 lines up nicely with the second to last all-time high we had in the market:
My views have been pretty clear about the progress, or lack thereof in the SPX over the last 19 months, there has been little, and each new incremental high from the prior has yielded real downside volatility:
-Jan 2018 high 2850 then 12% drop
-Oct 2018 high 2940 then 20% drop (new high by 3%)
-May 2019 high 2960 then 7.5% drop (new high by 1%)
-July 2019 high 3030 then 6.8% drop (new high by 2.5%)
So what gives? trump will keep tweeting, and whining about the Fed, about how unfair China has been, how he is the only one who can fix it blah, blah, blah… but the fact of the matter is that he is hurting the credibility of the Fed, his public threats and then walk backs are hurting any leverage we have with China and the ability to do a substantive trade deal, and all of this uncertainty is weighing on our economy at a time when we are clearly far stronger than most other regions. Can the S&P 500 make a new high? Sure, is lit likely to make meaningful progress from the prior highs over the last couple of years, nah… but does this one step forward two steps back situation present an opportunity for those looking to dollar cost average into stocks they look who think there will be some sort of resolution on trade in the coming year that will set the stage for a new leg of the bull market, than great, buy the dip… just don’t buy the breakout!
A quick update on the trade idea above from Aug 13, the Oct 290 – 263 put spread that cost $5 when the etf was $293 is now worth about $5.10 with the etf at $292.30, so minimal decline has offset the decay in both options. This trade is right where you want it if you think we will ultimately break lower and possibly below recent support at $283.
I would also add that the chart of the IWM, the etf that tracks the small-cap Russell 2000 index is a trainwreck on a relative basis to its large-cap peers since its 52-week and all-time highs made nearly a year ago, down 13% from those levels having bounced this week off-key technical support at $145 but stalling at what some might call resistance at its 200-day moving average:
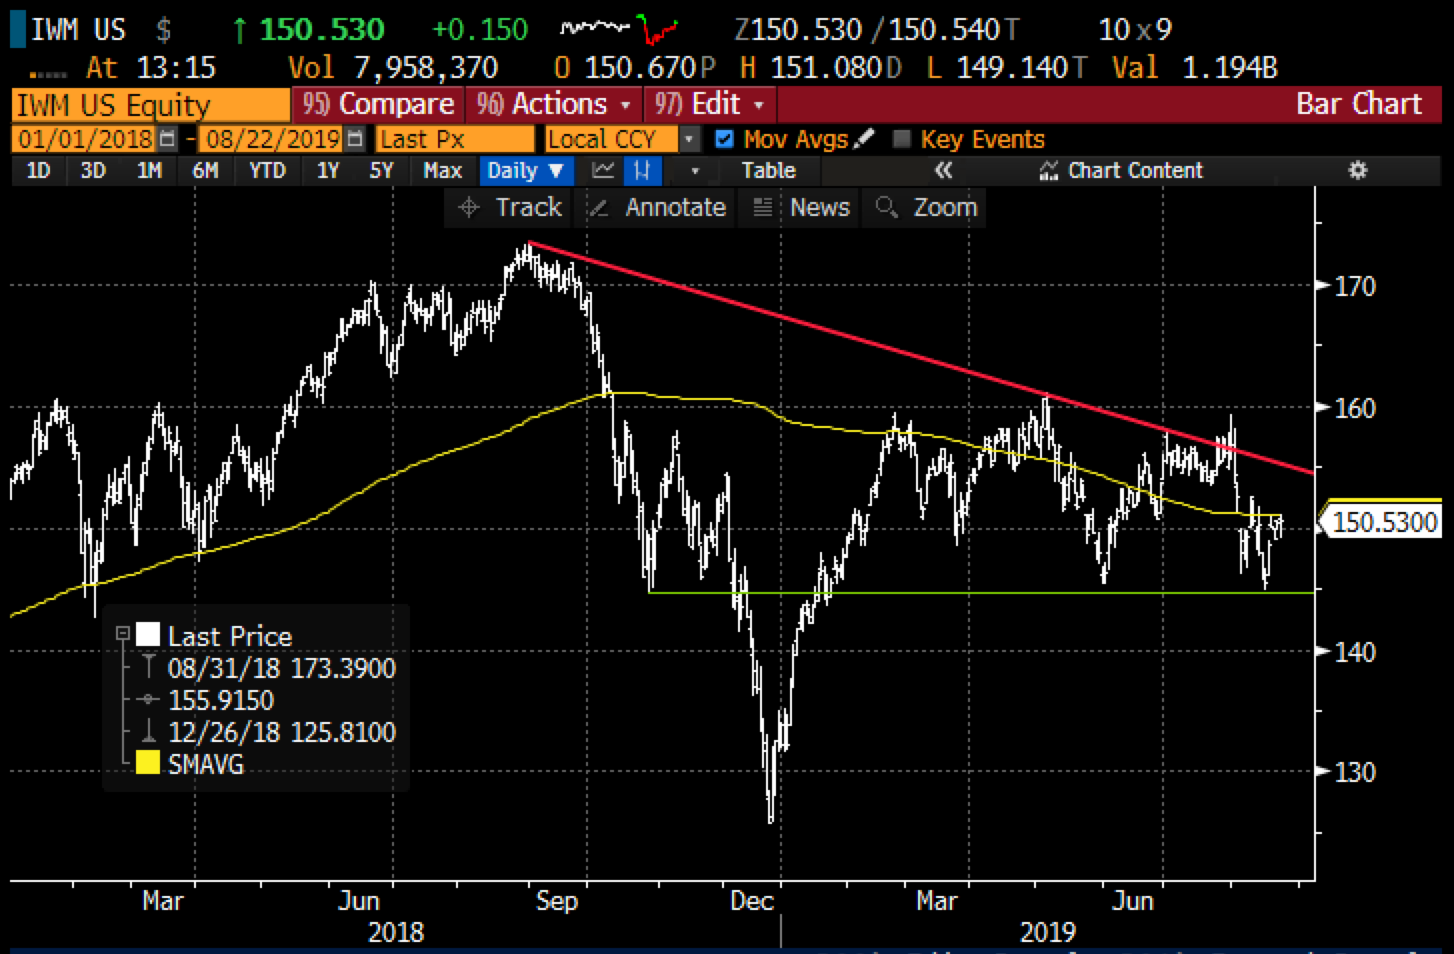
If you were looking at our equity markets to sniff out a recession, months or quarters before it hit, you would start with small-caps… If I were looking to make a bearish bet on the IWM over the next few months I might target a breakdown at that $145 level and possibly a move back towards the December lows. With the IWM at $150.50, the Nov 145 / 130 put spread costs about $2.50 with a break-even at $142.50 and max profit of $12,50 at $130 or lower on Nove expiration. The idea of selling a 3 month out downside put for less than 1% of the etf price might not make a ton of sense, but if you thought the IWM might bang around at current levels for a bit before it started a move lower after the summer it might help offset some decay in the 145s that you are long. If you thought we are on the precipice of a sharp move lower you would just buy the 145 puts and look to spread on the first sharp move lower in an effort to reduce you premium ar risk and sell an option when implied volatility has jumped. Either way a move back towards $155 without much news could present a great opportunity to lay the IMW out on the short side… I am keeping a close eye on this one… If we had a test of the downtrend near $155 then I might look at the Nov 150 puts, and possibly look to sell the $135s against. Stay Tuned.