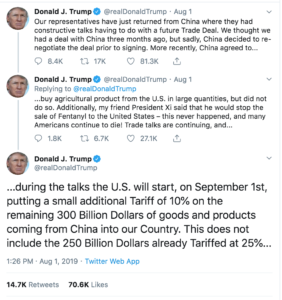
At 1:26 pm on August 1st president trump tweeted his displeasure with the ongoing trade negotiations with China and threatened a new 10% tariff on $300 billion of largely consumer goods that come into our country from China.
At the time, the S&P 500 (SPX) was trading around 2990 (red circle below), about 1.5% from the all-time high made just the prior week:
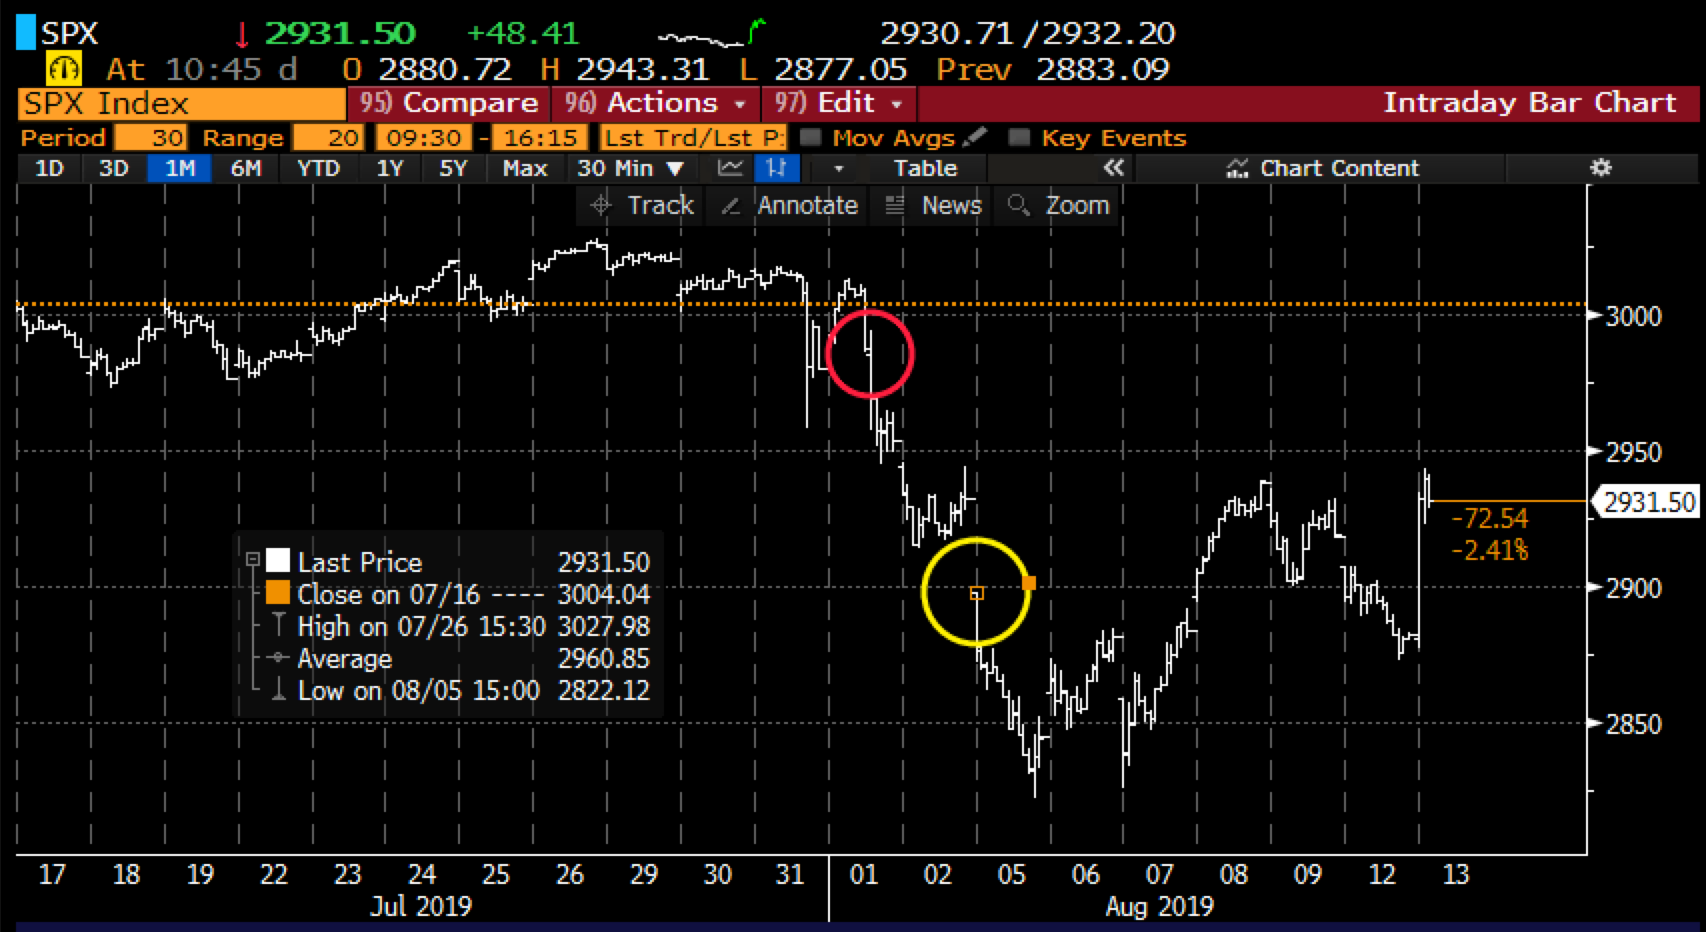
The threat of additional tariffs was step-up in the rhetoric as it has been a pre-requisite for the Chinese that they will not negotiate if new tariffs are put in place. The SPX had nearly a 7% peak to trough decline but has since bounced sharply with today’s announcement from the U.S. trade representative that for all intents and purposes these new tariffs (for most consumer items) will be delayed until December 15th.
The president is clearly playing stock market here, with markets near highs he plays tough guy… the Chinese retaliate by stating they won’t buy any more of our agricultural products and then last Monday the PBOC fixed their currency the yuan below 7 per dollar for the first time in 11 years and global equity markets went haywire causing the SPX to close down more than 3% last Monday (yellow circle above), its worst day of 2019. And then we get today’s news which feels like little more than a concession to a crisis created out of whole cloth by trump. Oh and one more thing, in the 1990s trump tried to play stock market, he bankrupted five companies.
What last Monday showed us is that a tit for tat ratcheting up of the trade war has the potential for unintended negative consequences and the manner in which trump wants to do it has the potential to push tensions to a point of no return. Oh and playing the stock market, as trump has done, not just with the trade situation, but with the Fed, and the Government shutdown last December the possibility of an accident that a tweet can not fix increases dramatically.
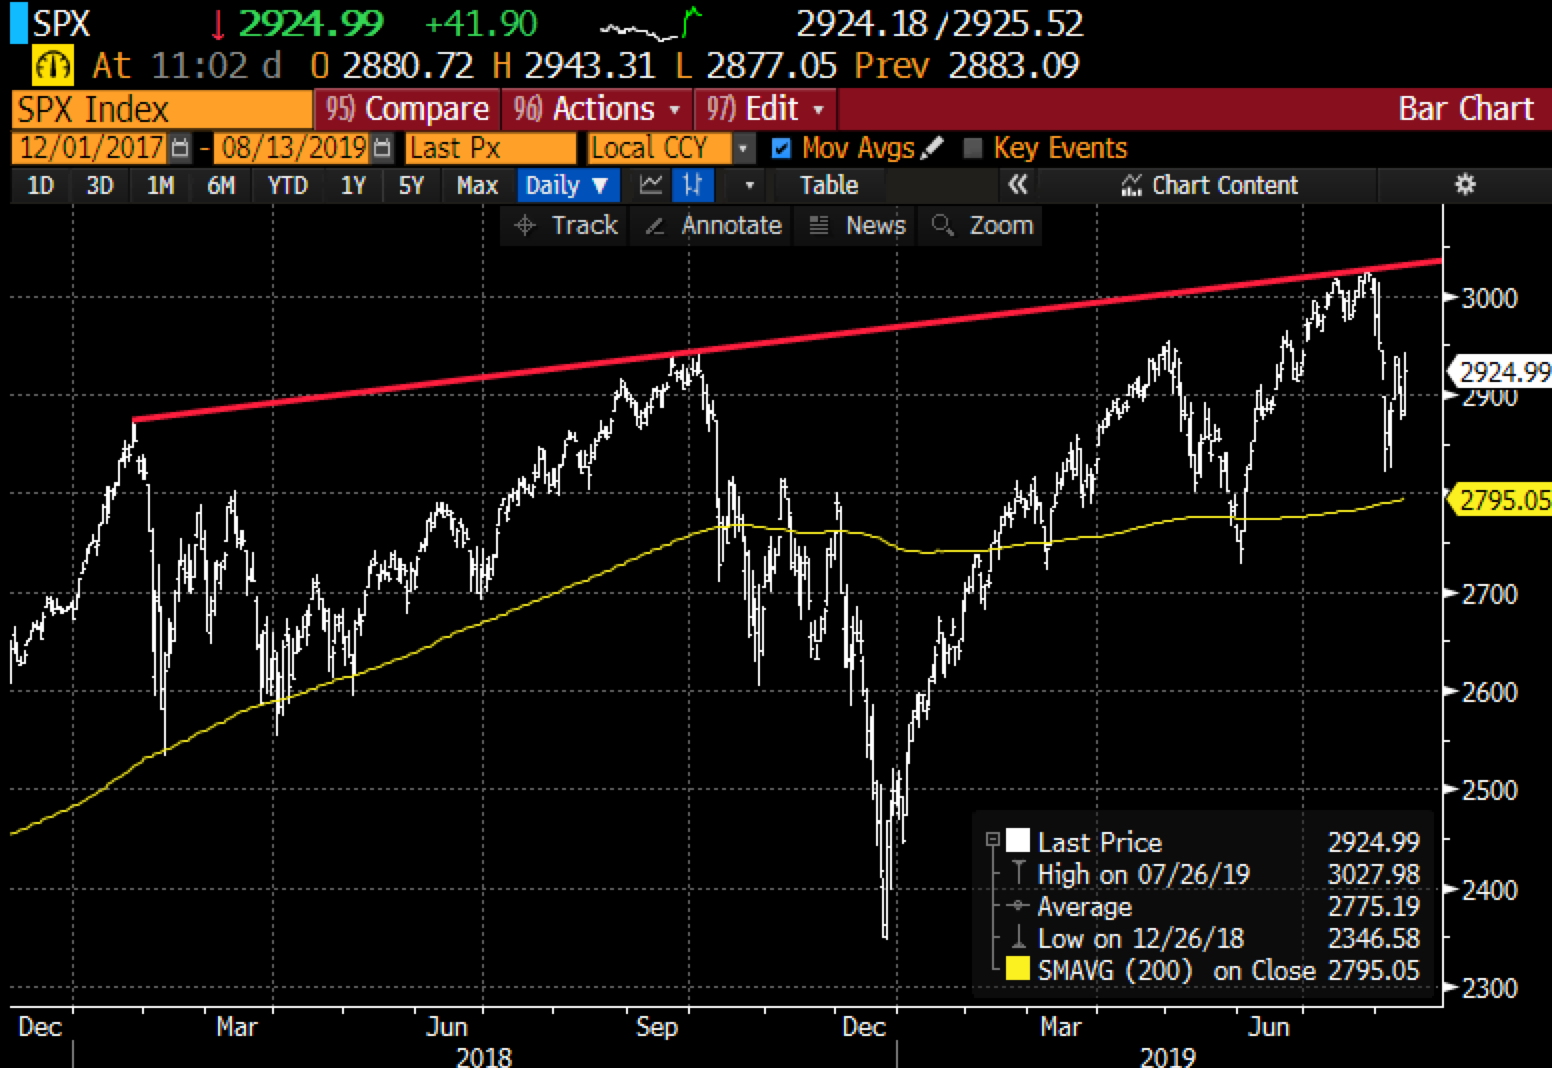
Looking at the SPX since the January 2018 blow-off top following the prior month’s passage of corporate tax cuts, the SPX has since made three new all-time highs, all less than 3% above the prior one, but I guess, more importantly, each new highs was met with a sharp decline:
-Jan 2018 high 2850 then 12% drop
-Oct 2018 high 2940 then 20% drop (new high by 3%)
-May 2019 high 2960 then 7.5% drop (new high by 1%)
-July 2019 high 3030 then 6.8% drop (new high by 2.5%)
You get the point… the SPX has resistance at that ever so slight uptrend when you connect the highs over the last 19 months, while there appears to be decent near term technical support around its 200-day moving average just below 2800.
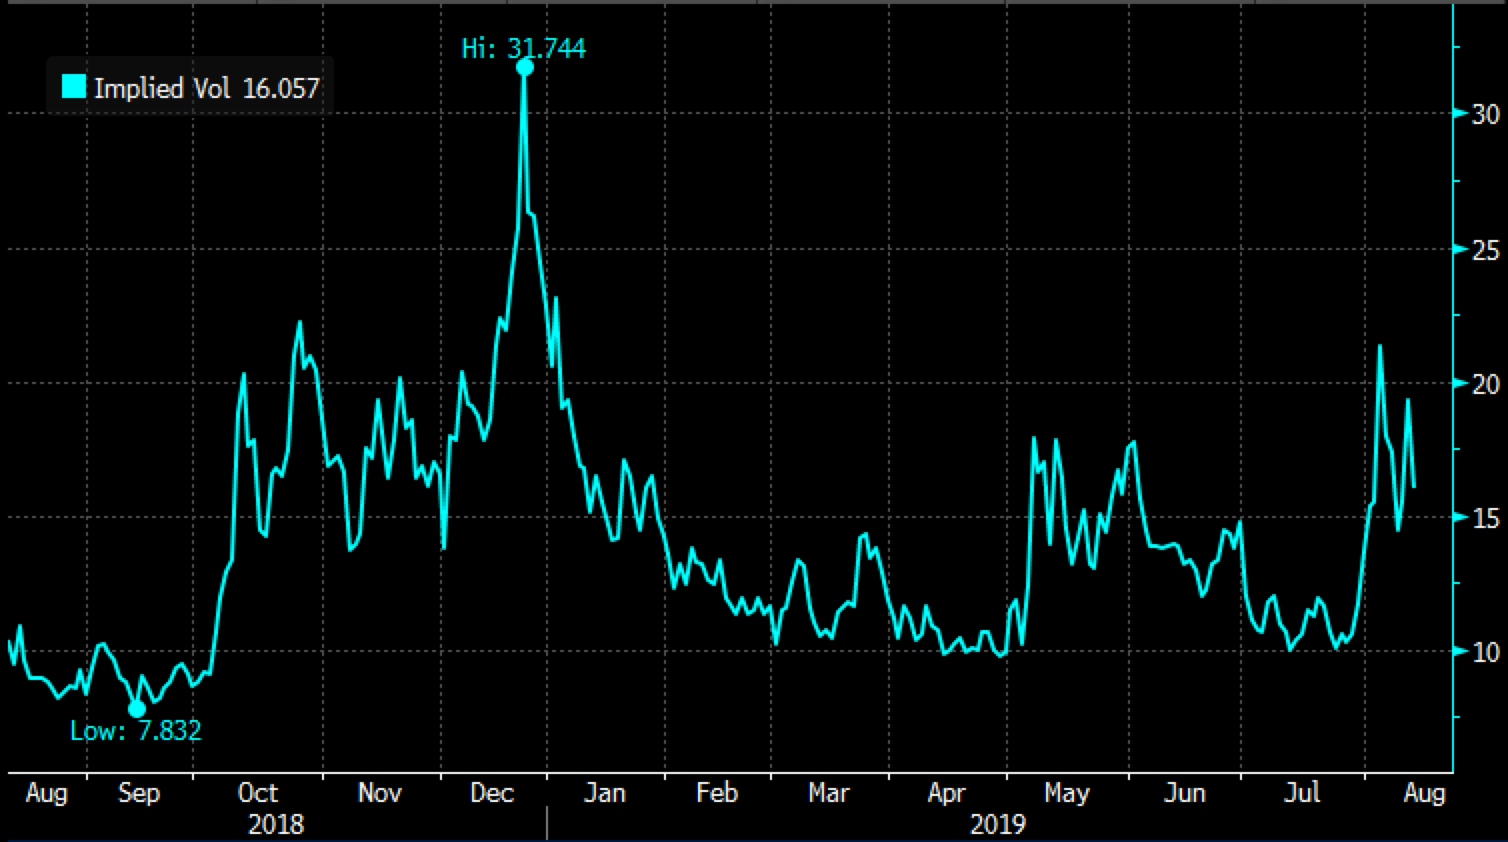
Looking at options on the SPY, the etf that tracks the SPX, the recent bout of volatility has caused options prices in the SPY to rally from very near 2019 lows in July with implied volatility at just 10% to just above 20% last week, and has since calmed down a bit.
I think regular readers know where I stand on trump’s negotiating tactics and his deal-making abilities, to be polite he is not what he says he is, and while he can push around public opinion on no shortage of issues via his Twitter account, there are only so many tweets in his quiver that will ultimately be able to prop up the stock market, he is not President for life as XI is, or control their central bank and currency the way XI does, trump’s tariffs are unpopular with his own party and his tactics are likely the main headwind to the “pro-growth” policies that got markets going higher in 2017. Since Jan 2018 the SPX has made little progress up about 70 points or less than 3% and the shocks are clearly to the downside.
SO what’s the trade? I suspect the commentary about trade will continue to ebb and flow… can the SPX go back and test the upper band of the uptrend that connects the highs? sure, but I suspect any re-test without a substantive trade deal (and I don’t just mean one that focuses on our trade deficit) will be a sell on the news.
If I were inclined to play for a pullback in the SPX in the coming months I might target a break of 2800 with the index heading back towards the Nov 2018 lows that ultimately broke in Dec near 2600 and use puts spreads in the SPY to define my risk.
Bearish Trade Idea: SPY ($293) Buy Oct 290 – 263 put spread for $5
-Buy to open 1 Oct 290 put for $7
-Sell to open 1 Oct 263 put at $2
Break-even on Oct expiration:
Profits of up to $22 between 285 and 263 with max gain of 22 below 263
Losses of up to $5 between 285 and 290 with max loss of $5 above 290
Rationale: this trade idea risks less than 2% of the etf price offers a break-even down 2.7% with a max gain of $22, or 7.5% if the etf is down 10%. This looks like dollar cheap protection to me playing for a 10% or so pullback over the next two months.