Minutes after the open this morning when the QQQ (the Nasdaq 100 etf) was trading $185.15. there was an opening buyer of 7,000 of the November 176 – 157 put spreads paying $3.11 to open. This put spread breaks-even down at $172.89, down 6.6% and offers a max payout of $15.89 at $157 or lower, down 15% from the trading level. This trade risks about $2.2 million, that goes poof if the QQQ closes above $176 on November expiration and could be worth a whopping $11.12 million at or below the short put strike.
Obviously, the put spread could be profitable prior to expiration if the stock were to decline towards the long put strike, but the break-even is still a ways away, and any increase in the value of the 176 put resulting from a decline in the etf price would have to offset the decay in the options. Currently, the Nov 176 put has about a 32 delta, which means that for every $1 move the options should move by 32 cents, in either direction. It also says right now that the options market is only placing about a 32% chance that the Nov 176 put is in the money on Nov expiration, while the short 157 put has only a 12 delta, or about a 12% probability of being in the money. Not exactly great odds of success, but I suspect a trade like this is a hedge against a portfolio of mega-cap tech stocks.
The QQQ is about 6% from its all-time highs made last month, now again approaching what some technicians might call massive near-term technical support:
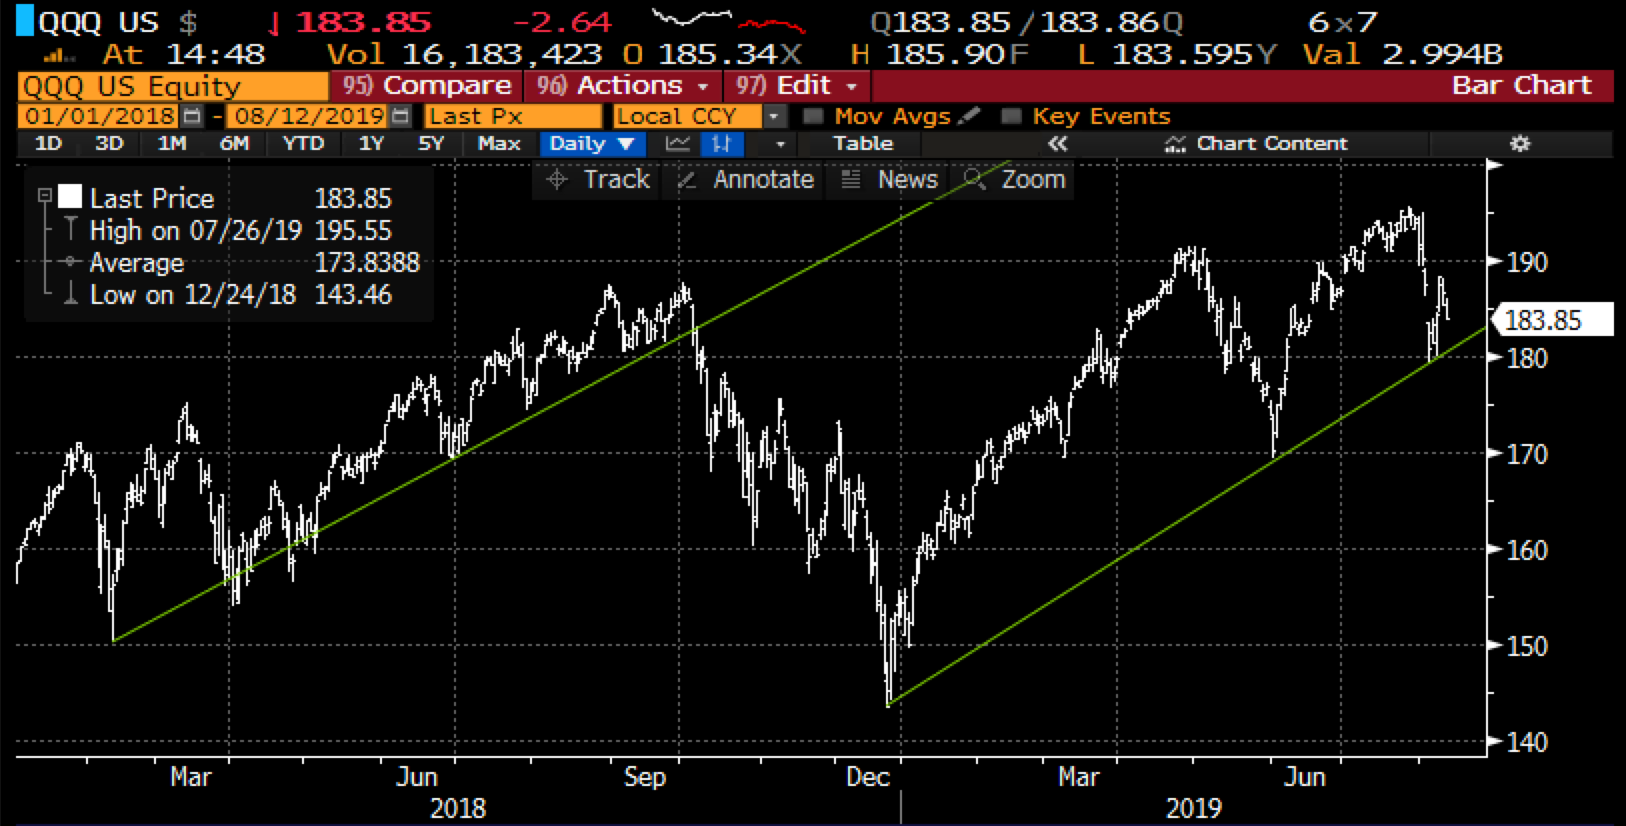
After some Q1 volatility in 2018, the broad market spent the next two quarters making a series of higher highs and higher lows into the new all-time high in Sept. But when the QQQ broke that uptrend, it was a series of lower highs and lower lows that crescendoed into a 20% peak to trough decline. You might look at the chart above and see a similar setup with the QQQ having made no progress year over year, trading 1% above where it was last Aug 12th.
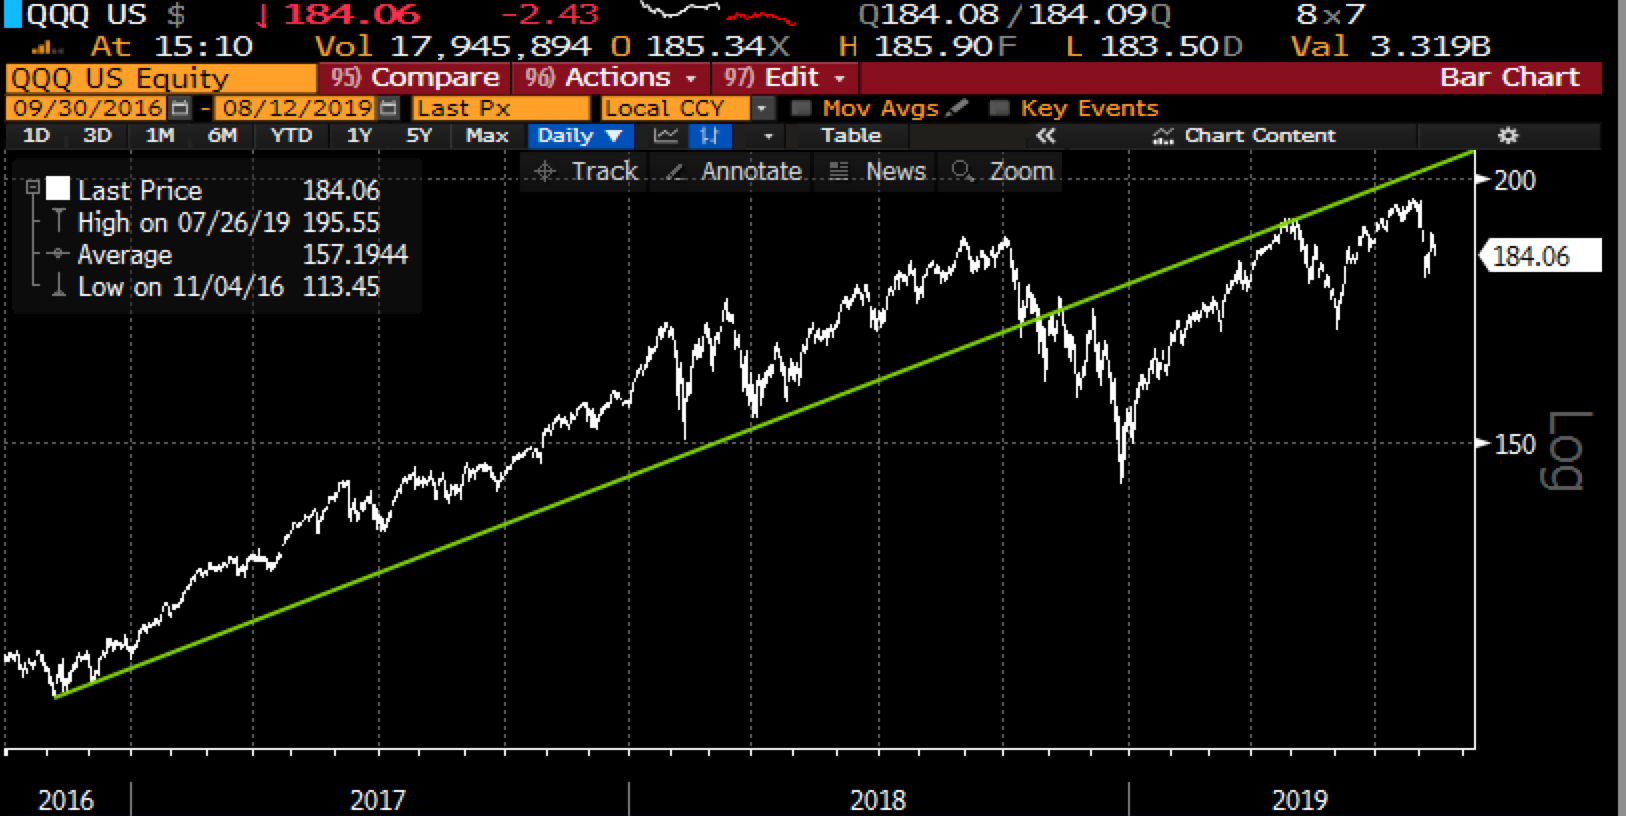
I would also add this nearly three-year chart which shows the uptrend that was in place from the lows in 2016, till the late 2018 break has now served as technical resistance to the new highs we have seen this year:
And you guys know why I find the QQQ so interesting… MAGA… MSFT, AAPL, GOOGL & AMZN, the four top holdings make up 40% of the weight of the etf of 100 stocks. What’s also interesting to me is that despite the Nasdaq, Nasdaq 100 and the S&P 500 making new all-time highs last month, MSFT was the only one to confirm those new highs. It has been my view that the incremental new highs made since the Jan 2018 highs, and there have been three have lacked the fire-power of the mega-caps that helped get us here.
Regular readers know that I place no special emphasis on unusual options activity as I have no idea what the trade might be against and what the intent of the trader/investor was for initiating the trade. I do though often find the activity as a useful input when looking at a stock or an etf as often times it is useful to get a sense for trader sentiment, and where some traders are looking for protection or possibly leverage.