Advanced Micro Devices (AMD) will report their Q2 earnings today after the close. The options market is implying about a 10% one day move tomorrow, which is shy of the 13% average over the last four quarters but inline with the ten-year average. With the stock trading at $33.50 the Aug 2nd weekly 33.50 straddle (the call premium + the put premium) is offered at about $3.10, if you bought that, and thus the implied move between now and Friday’s close you would need a rally above $36.60 or a decline below $30.40 to make money.
Shares of AMD are up a whopping 80% year to date, and up an eye-popping 107% from its 52-week lows made last October.
The one year chart is something of a work of art, after reversing its 100% q3 run up with a more than 50% decline in Q4, the stock has recently found some technical resistance at the prior high just below $35. The implied move suggests the stock could be poised for an epic breakout on a beat and raise or at the very least a re-test of the uptrend which the stock has held like a boss since its December lows:
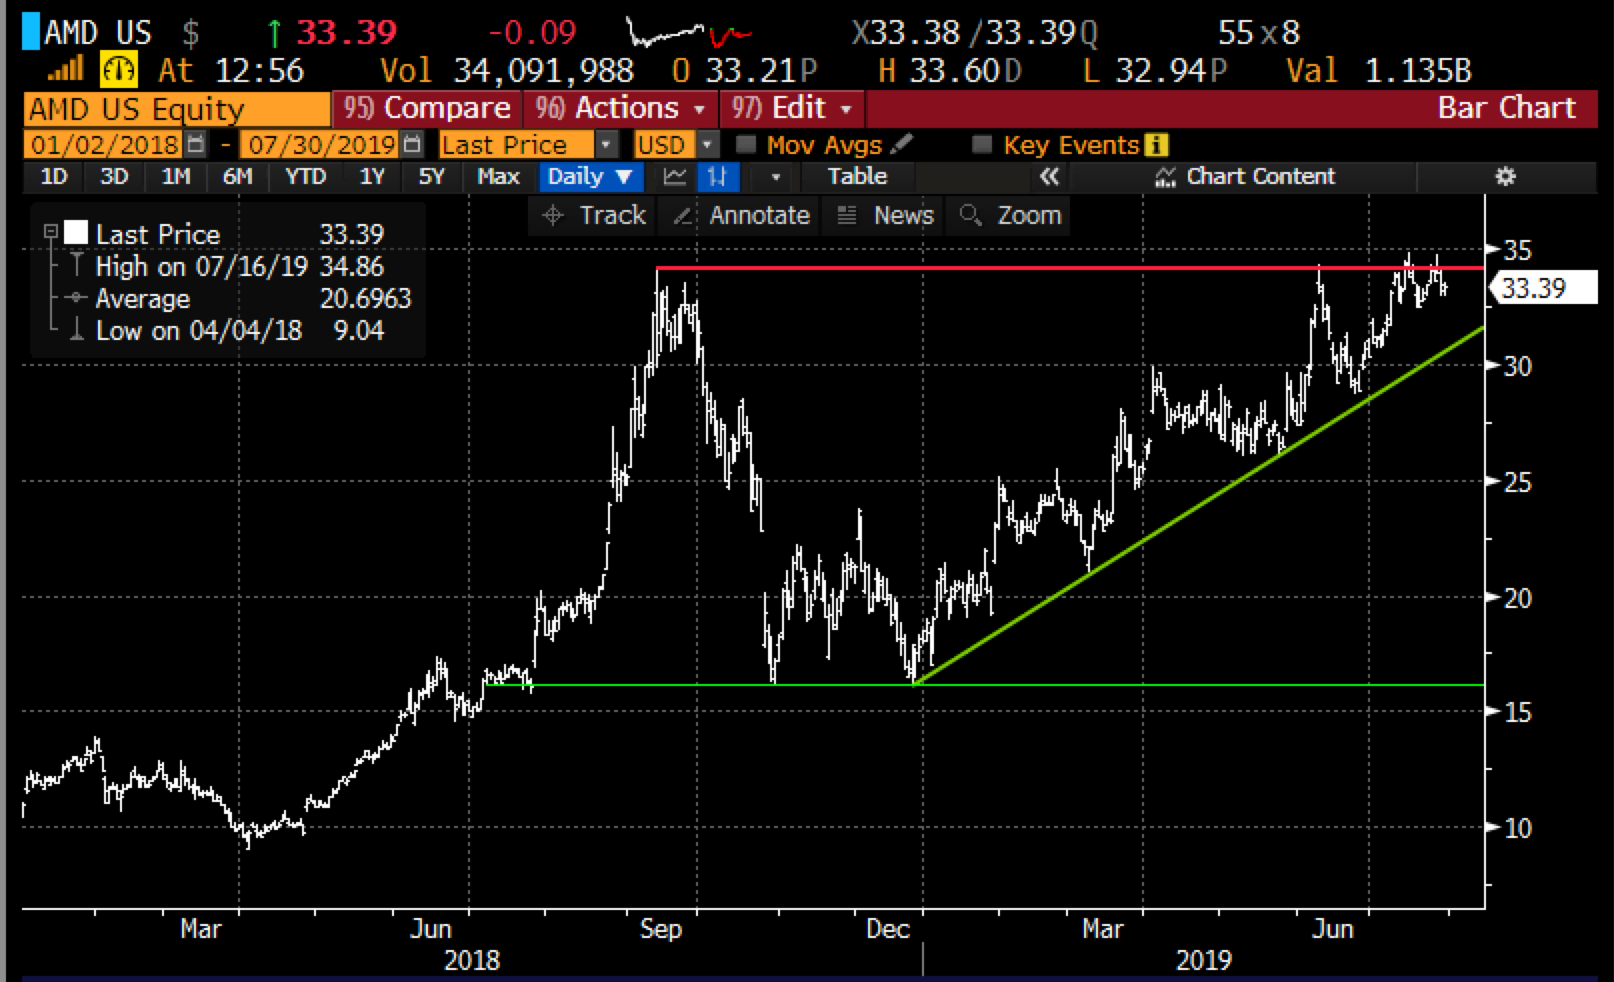
Despite the stock’s strong YTD performance, but likely the result of the stock’s massive volatility over the last year, Wall Street analysts are very mixed on the stock with 16 Buy ratings, 16 Holds and 5 Sells, with an average 12-month price target among them of $30.30, 10% below where the stock is trading.
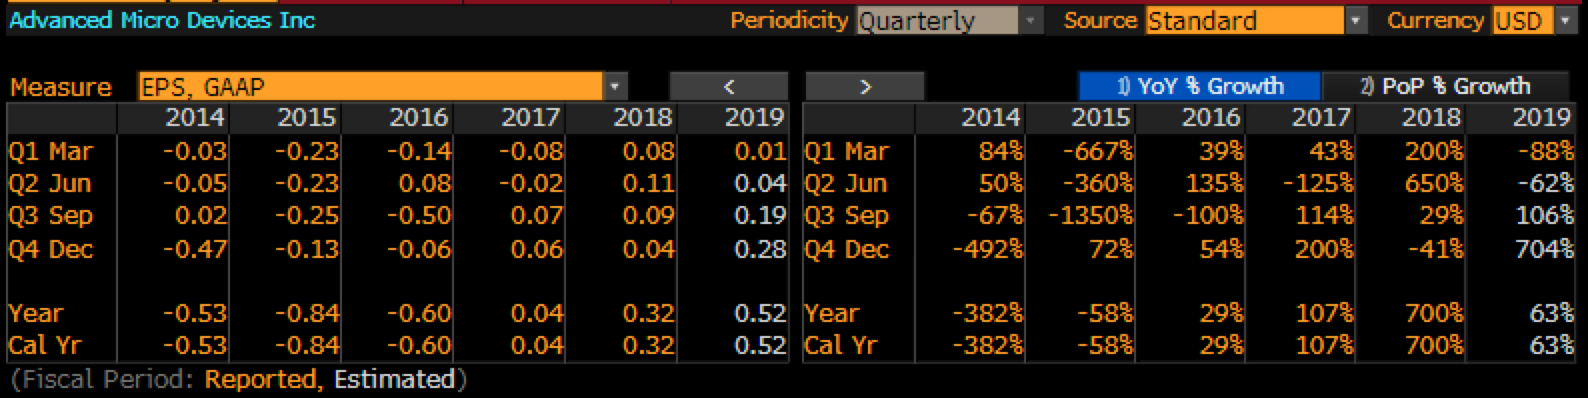
One reason for the stock’s volatility over the past few years is likely the volatility in the company’s earnings with heavy losses in 2012 through 2017, that year squeaking out a 4 cent profit.
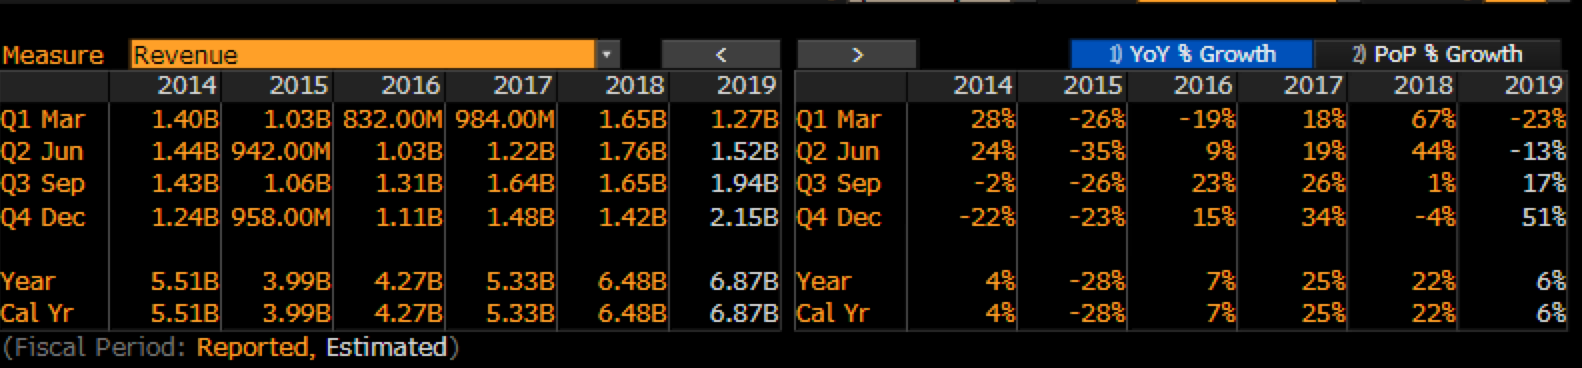
Profits have been a recent occurrence on a GAAP basis, but its also worth noting that their annual sales have also been fairly volatile, with 2019 expected to mark a new peak above 2011 levels:
Expectations into the Print: To suggest they are high is an understatement. AMD’s YTD gains are almost 2.5x that of the SOX, but the company has been in a fairly fortunate position despite the headwinds of the trade war with China, they have been in the right place at the very right time on the product front where some of their competitors, like Intel (INTC) in particular have had poor execution on key CPU upgrades and for the first time in a very long time had competitive products with graphics chip rival Nvidia (NVDA) which has aided in market share gains from other players in the space.
The stock trading at 53x current 2019 eps expectations, 33x expected 2020 and 130x trailing… expectations are clearly high for continued profitability. There are no shortages of challenges to AMD’s second-half guidance… long the trade war will last? will we have increased tariffs? will INTC recapture lost market share as they get set to launch their 10-nanometer chip in 2020? will PC shipments continue to surprise to the upside? Your guess is as good as mine, but it is worth noting that despite little to no progress on trade, in the last couple weeks commentary on the second half from Semi behemoths Taiwan Semiconductor, Texas Instruments, and even Intel was cautiously optimistic that the current cycle is closer to the end than the beginning 2-3 quarters ago.
So what’s the trade?
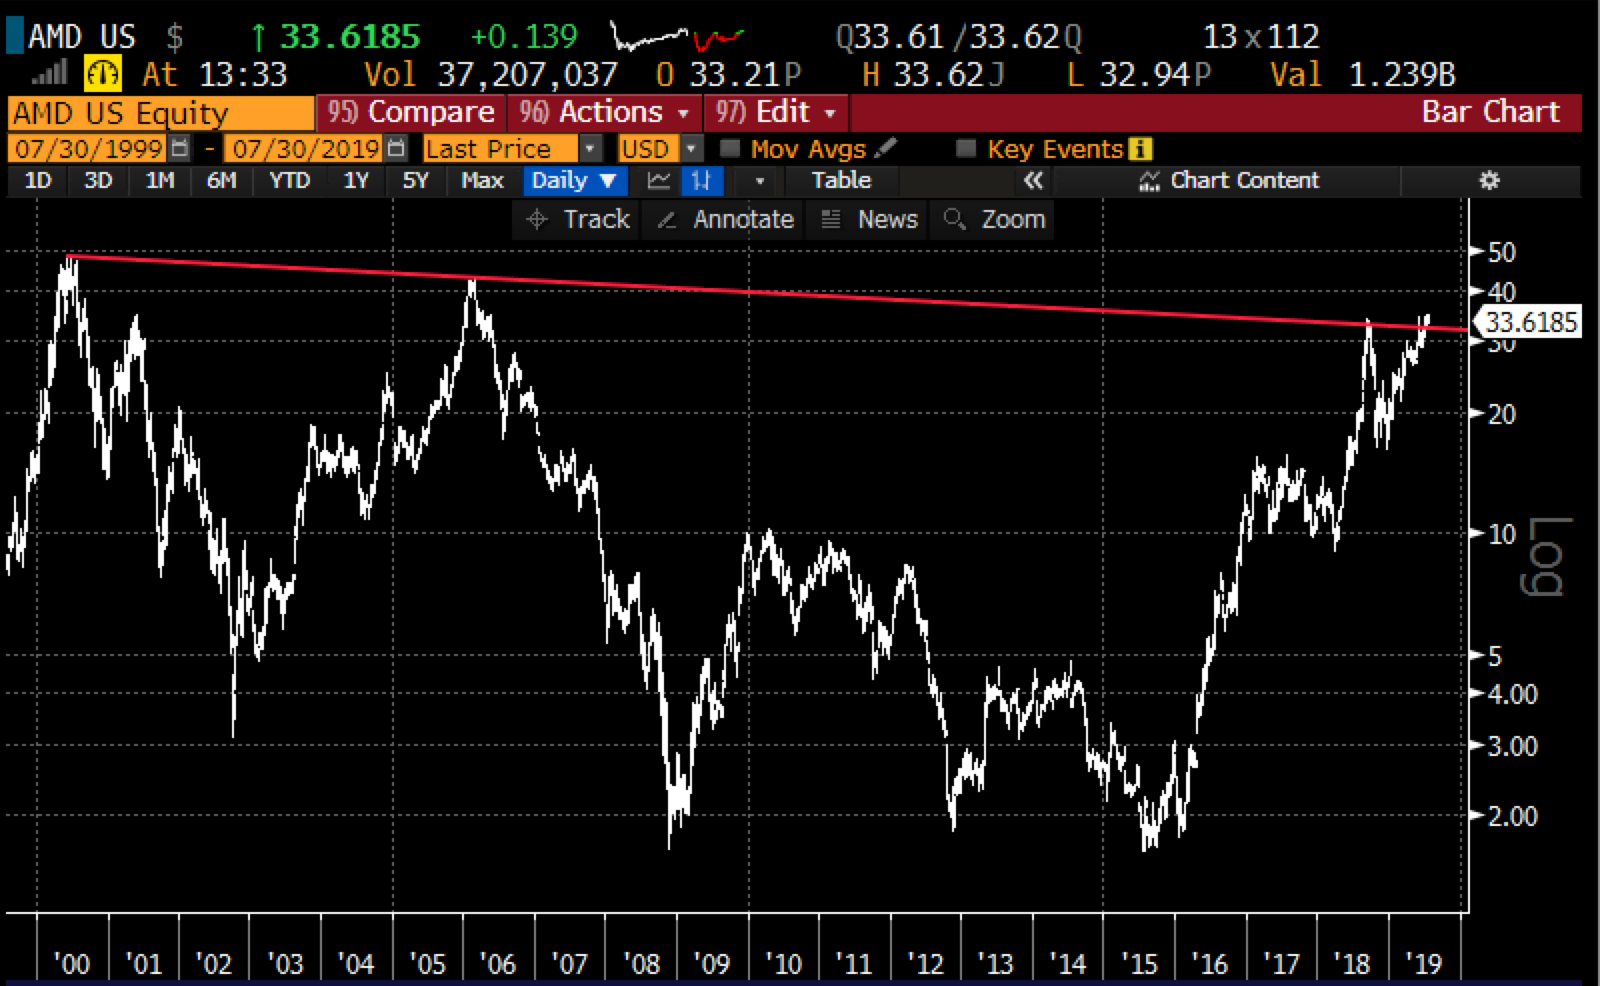
If I thought the company would issue an earnings beat and offer upbeat guidance for at least Q3 then playing for a massive breakout makes sense. The 20-year log chart below shows the stock just not picking its head up above 2018 high, but importantly above the downtrend from the last two market top’s peaks with $50ish being the top in 2000 and $45ish the top in 2006, both would be the next levels of massive technical support:
If I were to play for a beat and raise and a breakout above the downtrend I might consider the following call spread in September allowing for the move to catch some steam in the coming weeks:
Bullish Trade Idea: AMD ($33.50) Buy Sept 34 – 42 call spread for $2
-Buy to open 1 Sept 34 call for $2.35
-Sell to open 1 Sept 42 call at 35 cents
Break-even on Sept expiration:
Profits of up to 6 between 36 and 42 with max gain of 6 above 42
Losses of up to 2 between 34 and 36 with max loss of 2 at 34 or lower.
Rationale: this trade idea offers a break-even up 7%, less than the one-day implied move, but allows for the thesis to play out over 6 weeks with a potential payout of 3x the premium ar risk.
Or
If I were inclined to play for an unexpected miss and guide lower I might look for the decline to be sharp and quick and play in August expiration with put spreads, for instance…
Bearish Trade Idea: AMD ($33.50) Buy Aug 32 – 28 put spread for $1
-Buy to open 1 Aug 32 put for $1.20
-Sell to open 1 Aug 28 put at 20 cents
Break-even on Aug expiration:
Profits of up to 3 between 31 and 28 with max gain of 3 at 28 or lower
Losses of up to 1 between 31 and 32 with max loss above 32.
Rationale: this trade idea has a break-even down 7.5% with a max gain of 10% of the stock price down 16.5%, but let’s not forget this stock is up 80% ytd and the implied one day move is 10%. This trade idea offers a favorable risk-reward profile if you were to get the direction right…
Which leads me to our normal disclaimer… As we often highlight when discussing long premium directional trades into earnings… you need to get a lot of things right to merely break-even, direction first and foremost, the magnitude of the move and of course timing. Buying at the money weekly options into events like earnings can be very Binary and should be used for those with high conviction when one is looking to define their risk, or hedge a long or short position, or possibly add leverage but be cognizant of risking what you are willing to lose.