Alphabet (GOOGL) will report their Q2 earnings today after the close. The options market is implying about a 4.5% one-day move tomorrow in either direction or about $50, which is basically inline with the average one-day move over the last 4 quarters and a tad below the 10-year average of about 5%.
With the stock near $1126, the weekly July 26th expiration (tomorrow) 1125 straddle (the call premium + the put premium) is offered at $50, if you bought that, and thus the implied one day move, you would need a rally above $1175, or a decline below $1075 by tomorrow’s close to make money.
GOOGL’s 8% YTD gains is far less than the S&P 500’s 20% and The Nasdaq Comp’s 25% YTD gains, and seems fairly paltry to the rest of its MAGA peers YTD gains with AAPL up 32%, AMZN up 32% and MSFT up 38% YTD.
The chart since the start of 2018 shows a very range-bound, with a massive double top put in back in April, from all-time highs near $1300:
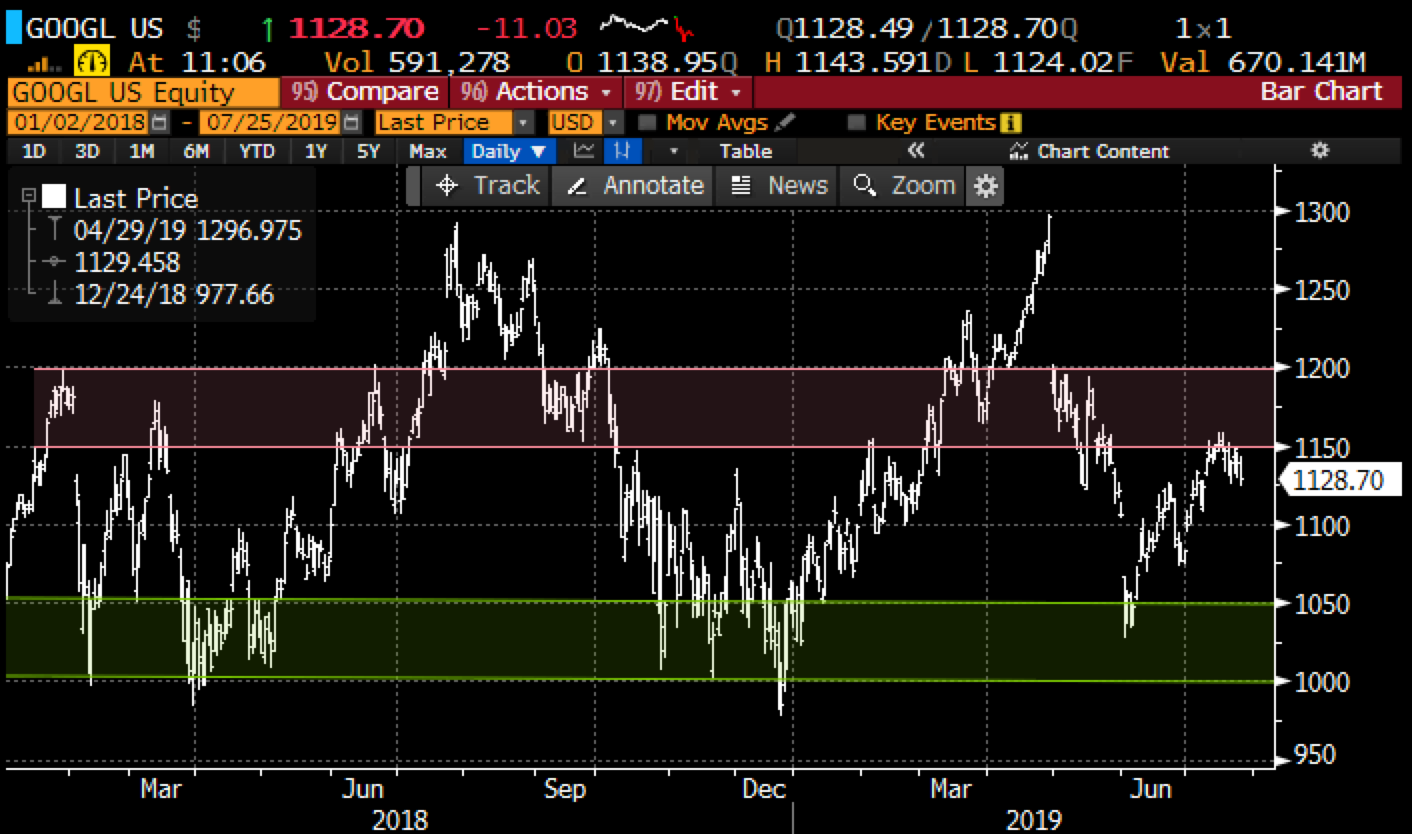
Interestingly the stock has healthy near-term technical resistance between 1150 to 1200 and equally healthy support between 1050 and 1000.
As for what to expect in the quarter, top-ranked Internet analyst Mark Mahaney from RBC Capital, who rates GOOGL a Buy with a $1300 target expects (from research note last week):
For Q2:19, we are expecting Gross Revenue of $37.87B, Net Revenue of $30.62B, GAAP Operating Income of $8.35B, and GAAP EPS of $10.87. Our estimates are a tad below consensus across the board (Street at $38.15B Gross Revenue, $30.85B Net Revenue, $8.60B Operating Income, & $11.10 GAAP EPS)
Mahaney highlights the following “Key Items to Focus On”:
1) Revenue and Operating Margin Trends for Core Google: We are looking for Core Google Gross Revenue of $37.71B (up 16% Y/Y), driven by ongoing strength in Mobile Search, YouTube, Hardware and Programmatic. We are also looking for $10.50B in Core Google GAAP Operating Profit (27.8% margin, which would indicate flattish Y/Y margins, with the slowdown in employee adds one positive factor).
2) Gross Google Properties Revenue: Within Core Google is Google Properties Revenue which includes core Search and YouTube. We are looking for $26.97B in Gross Google Properties Revenue, which would represent growth of 16% Y/Y.
3) Revenue for Google Other: We are looking for $5.5B in Google Other Revenue, which would represent 24% Y/Y growth. Google Other Revenues includes Hardware, Play, and Cloud.
4) TAC: In terms of TAC, we are generally modeling muted ongoing growth in TAC (20bps Q/Q for both Google Properties and Network Sites bringing them to 13.4% and 69.6%, respectively).
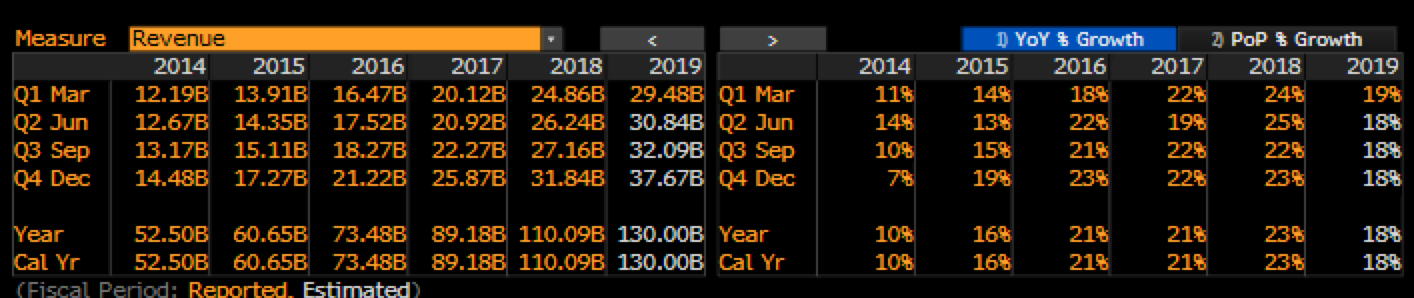
My Take Into the Print: Last quarter the company’s revenue miss, was the first growth print below 20% yoy, sending the stock down 7.5%. Analysts now expect 18% revenue growth for the year the lowest since 2015.
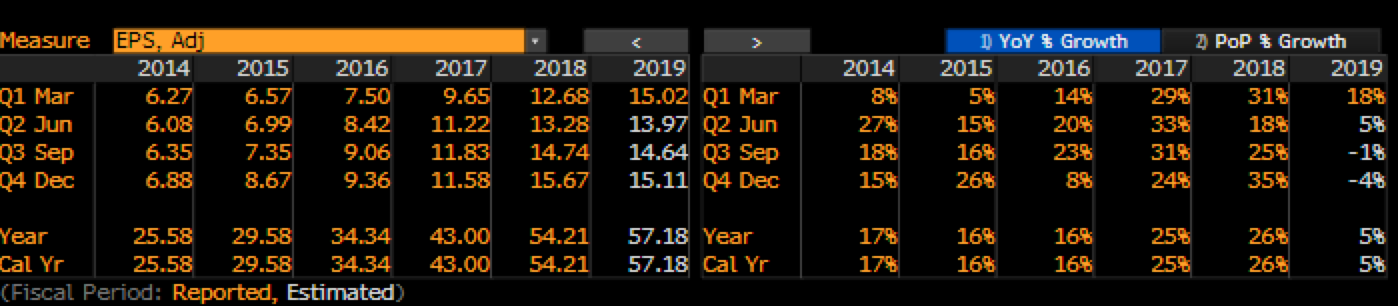
GOOGL’s EPS growth is expected to meaningfully decelerate to just 5% this year, this despite the company announcing on last quarter’s call that 2019 capex and headcount growth is slowing, think lower costs, higher profits. This will be of particular focus, are costs going down because they need to be if the company is seeing slowing revenues and possibly greater costs associated with ongoing regulatory activities.
In my Q1 earnings preview in April I suggested:
Given the fines that FB is being forced to pay, and the scrutiny on the company, I would not expect GOOGL to take their foot of the pedal, that appears to be on the metal on the cost front for at least another couple quarters. They at least need to the optics that they are doing everything in their power to combat their platforms being co-opted by bad actors in the lead up to the 2020 US presidential campaign. Trading at 27.5x expected 2019 eps growth of just 6% looks like a fat spread when you consider how easily it rolled off the tongue to say 1x PE to Growth even in the mid-20s over the last few years.
So those costs that I alluded to are built into 2019 consensus, the direction in the stock tomorrow and in the coming weeks will be a result of those two factors detailed above, two consecutive quarters with declining sales will have this stock on its way back to 1050, possibly 1000 in the coming weeks. A beat and reasonable confidence of slightly higher sales for the second half, coupled with the reiteration of capex growth slowing and the stock is on its way back towards 1200.
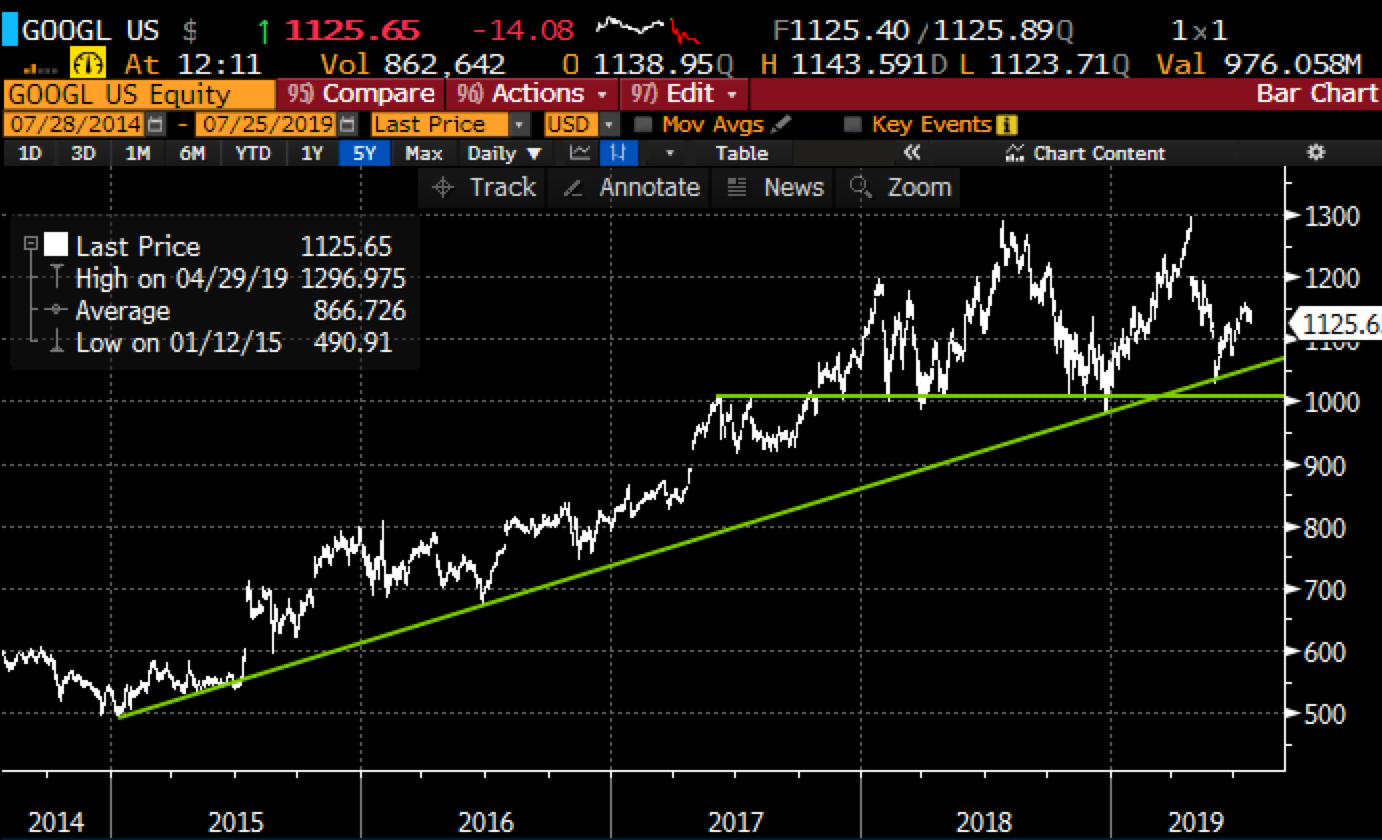
One last thing, while the 18-month chart above shows a stock that has been basing in a 30% range its worth noting that the stock is sitting right on its uptrend since early 2015 and $1000 is the line in the sand that I am not sure you would want to own the stock below if it foes there quickly on worse than expected results and guidance:
So what’s the Trade?
Short-dated options prices seem dollar cheap to me. If you thought the company could beat Q2 and guide higher then the stock is likely on its way back to $1200 in the days/weeks to come. With the stock at $1126, the July 26th weekly 1125 call is offered at $25 or 2.25% of the stock price for a break-even up at $1150, up 2.2%.
On the flip side, a miss and a guide down and the stock is likely on its way back to $1080 in the days/weeks to come. With the stock at $1126, the July 26th weekly 1125 put is offered at $25, or 2/25% of the stock price, with a break-even at $1100, down 2.2%.
As we often outline when discussing long premium directional trades into earnings… you need to get a lot of things right to merely break-even, direction first and foremost, the magnitude of the move and of course timing. Buying at the money weekly options into events like earnings can be very Binary and should be used for those with high conviction when one is looking to define their risk, or hedge a long or short position, or possibly add leverage but be cognizant of risking what you are willing to lose.
If I were looking out more than a day I might consider defined risk trade ideas in Aug or Sept expiration which target the technical ranges identified above. For instance:
If I were inclined to play for a pullback in the coming weeks/months of squishy guidance, I might consider the following put spread in June expiration:
Bearish Trade Idea: GOOGL ($1126) Buy Sept 1115 – 1000 put spread for $30
-Buy to open 1 Sept 1115 put for $36.50
-Sell to open 1 Sept 1000 put at $6.50
Break-even on Sept expiration:
Profits of up to 85 between 1085 and 1000 with max gain of 85 at 1000 or lower
Losses of up to 30 between 1085 and 1115 with max loss of 30 at 1115 or higher
Rationale: this trade offers a break-even inline-ish with the implied move for earnings, and profit potential of up to 3x the premium at risk, decent risk-reward for those who see the stock back towards 1000 by mid-Sept
OR
Or If I were Inclined to play for a breakout above 1150 on better than expected results, with the stock on its way to a gap fill near 1200 I might consider the following call spread in August expiration:
Bullish Trade Idea GOOGL ($1126) Buy Aug 1150 Call for $22
Break-even on Aug expiration:
Profits above 1172
Losses of up to 22 between 1172 and 1150 with max loss of 22 below.
Rationale: This trade risks 2% of the stock price for nearly a month of upside exposure with a break-even up 3,75%