Boeing (BA) has faced groundings of its popular airlines in the past. in the very early years of this decade, it was their 787 Dreamliner plane which was experiencing issues with its lithium-ion batteries that caused the grounding of all of their dozens of planes that were in use around the world. The uncertainty about when the planes would be back in the air and what the effects would be on future orders and deliveries weighed on the stock, causing it to base between $60 and $80 from 2010 to the end of 2012. with a 30% peak to trough decline in mid-2011 when the uncertainty regarding the plane’s future and the impact on the company’s financials was at its heights.
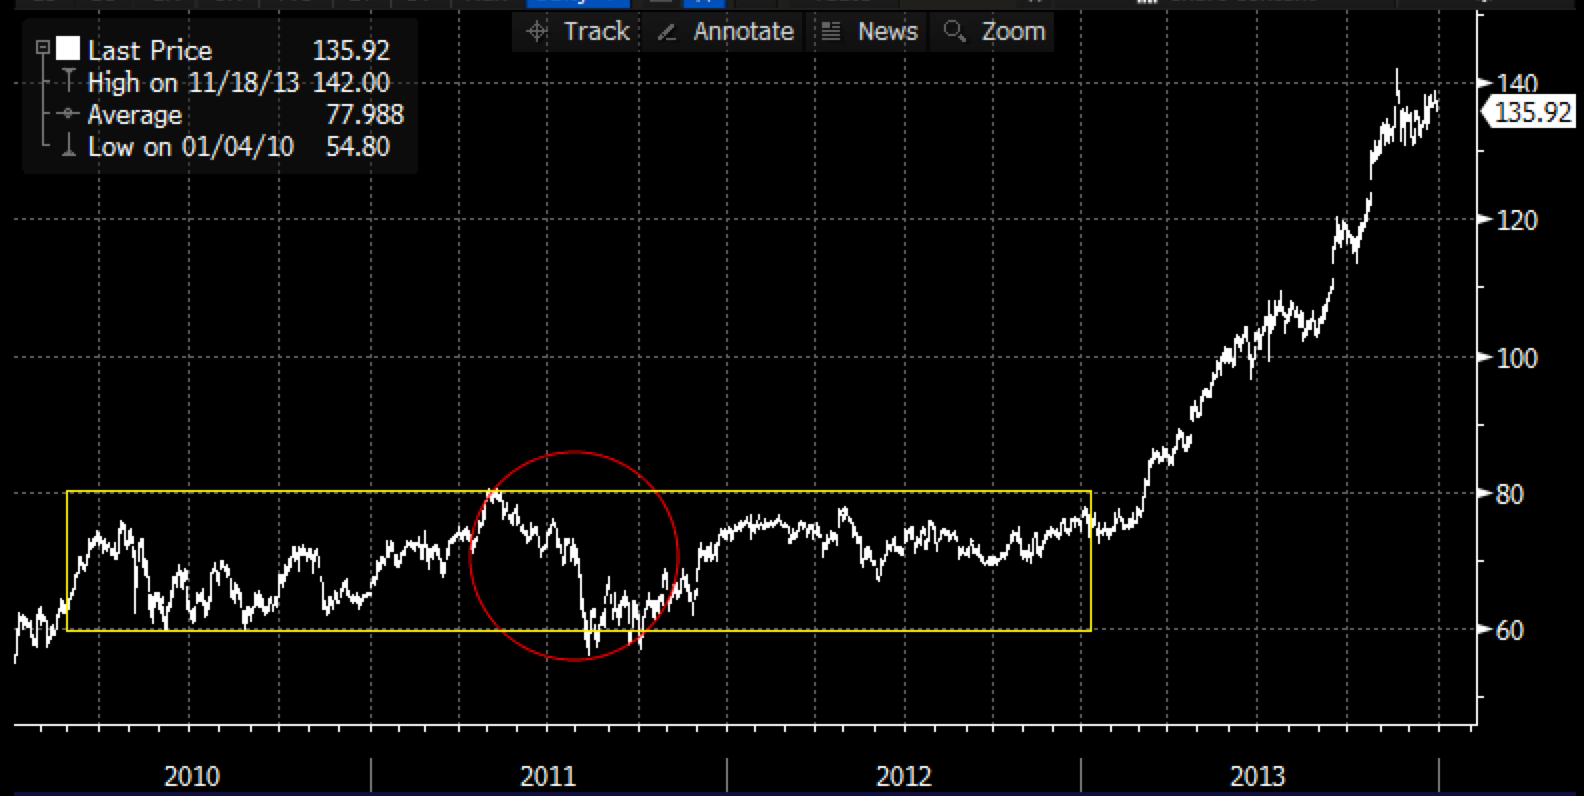
It is worth noting that throughout all of the uncertainty BA’s earnings continued to rise about 20% a year from 2011 till 2014 largely the result of the 787 not being a massive contributor to earnings and sales at the time:
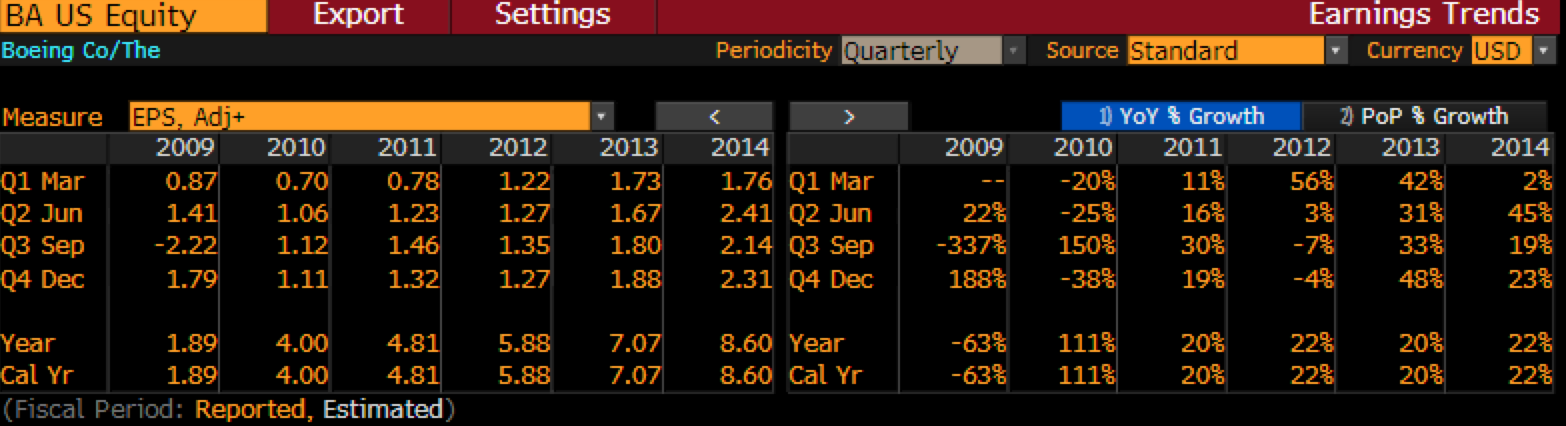
Following the early 2013 FAA ruling that BA could restart test-flights of the planes following a battery redesign, the stock was off to the races gaining a whopping 80% that year.
Subsequently, BA fearing gains on the smaller end by rival Airbus, the company announced in mid-2011 that they would redesign their 737 planes, making it lighter, faster, with larger engines but greater fuel efficiency than its predecessor, initially racking up 5,000 order making it the fastest-selling plane in BA’s history.
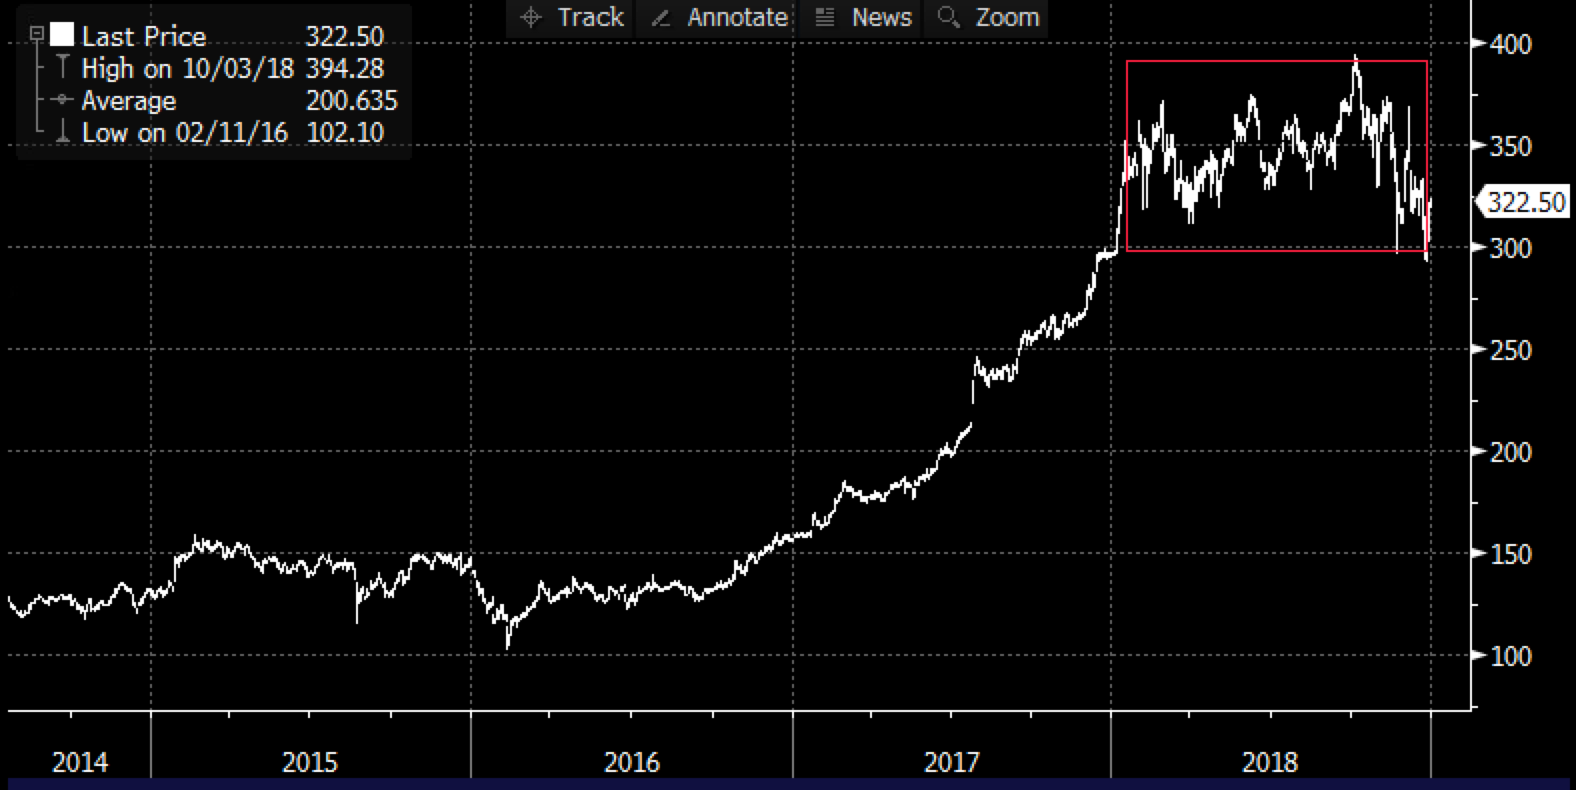
Despite that, BA stock spends the better part of 2014 through 2016 trading basing between $120 and $160 after nearly doubling the prior year:
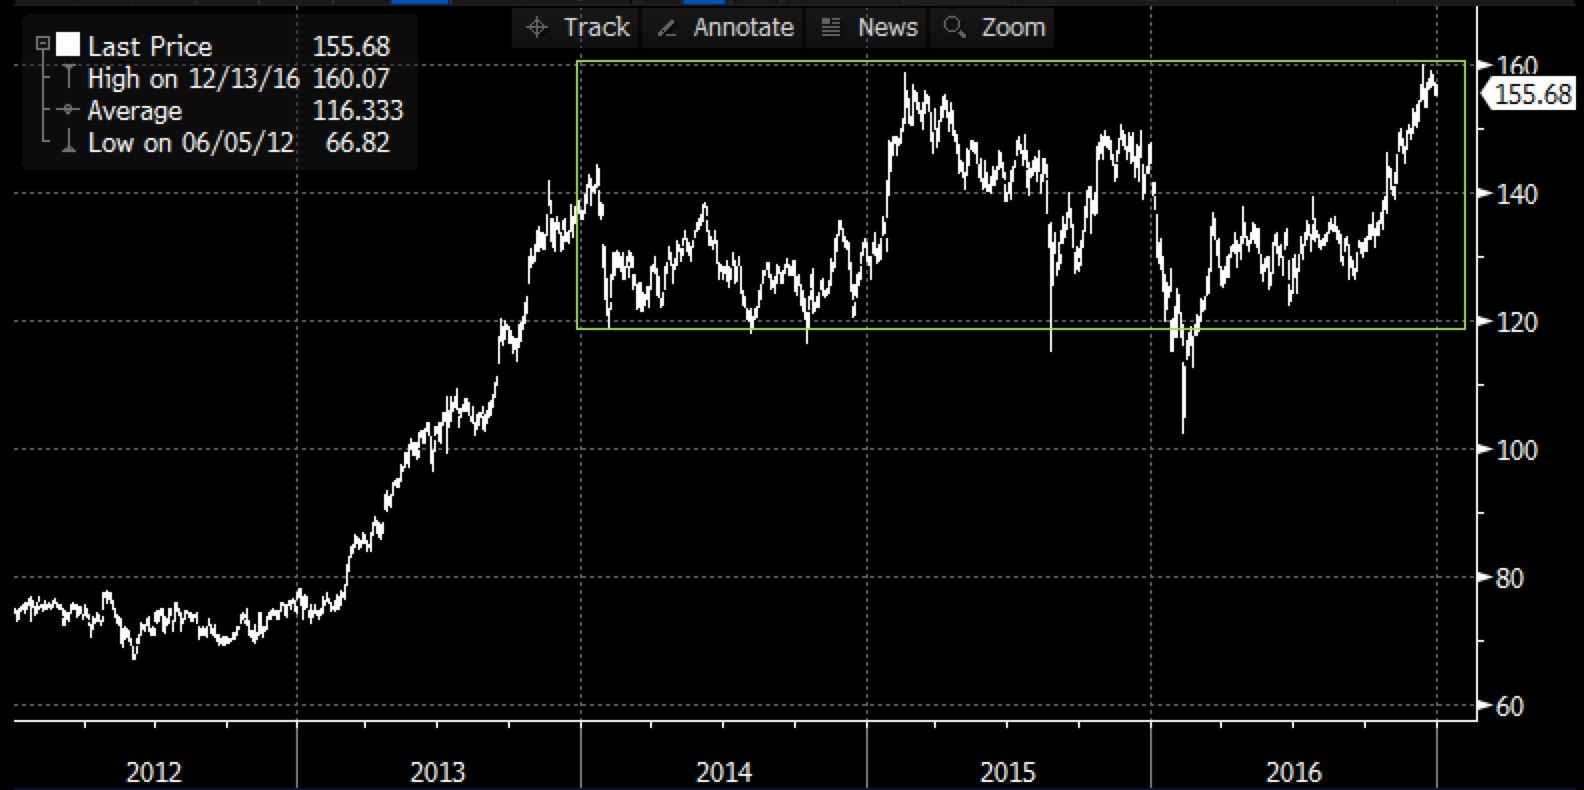
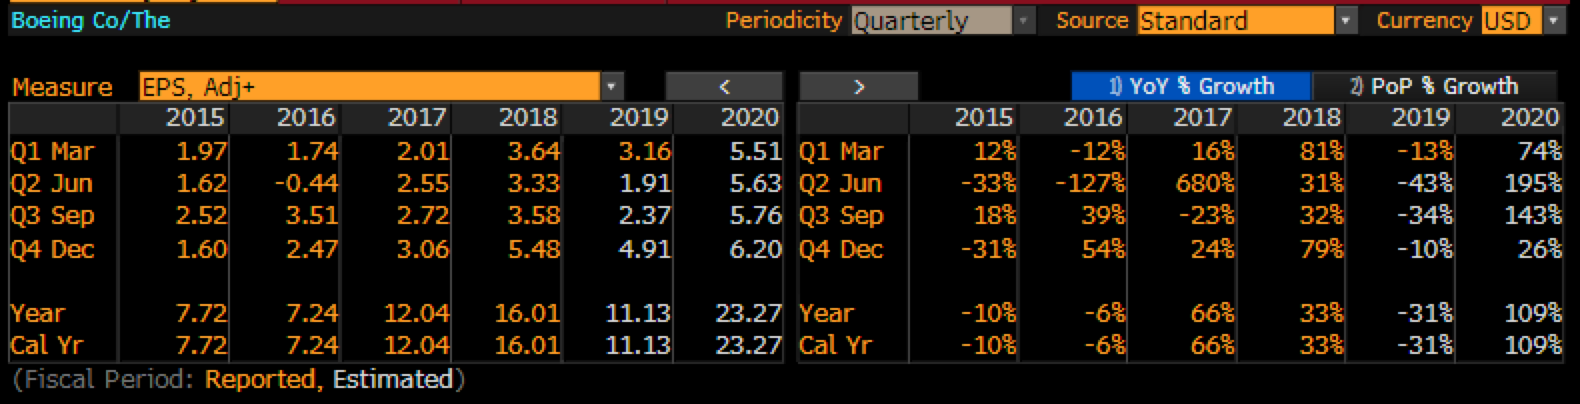
This consolidation coincided with two consecutive eps declines in 2015 and 2016 as Dreamliner sales failed to accelerate and Max had yet to deliver.
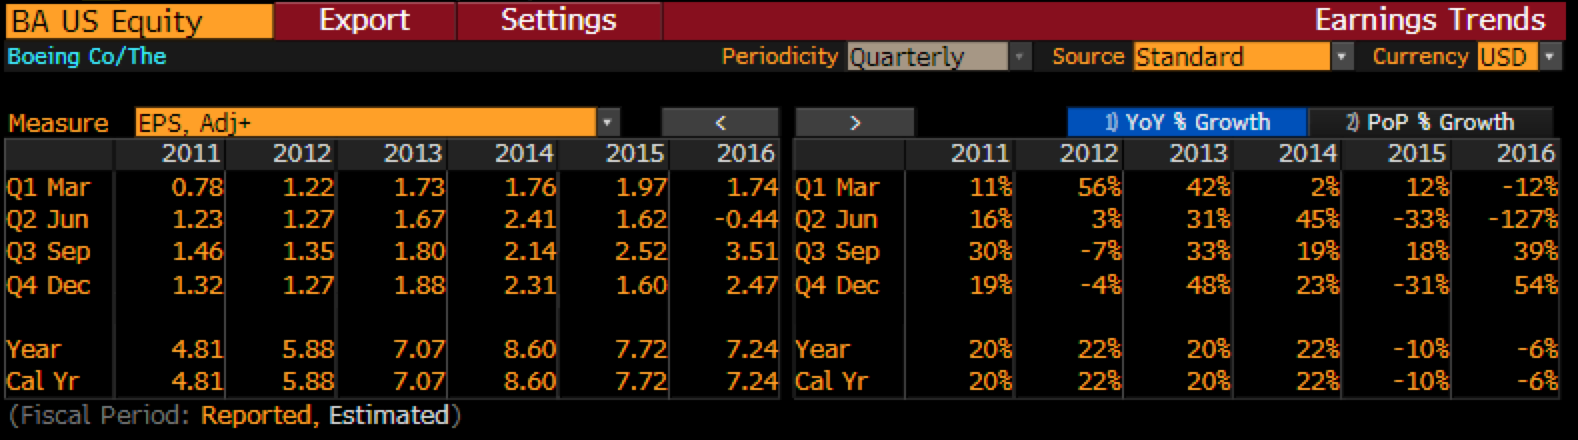
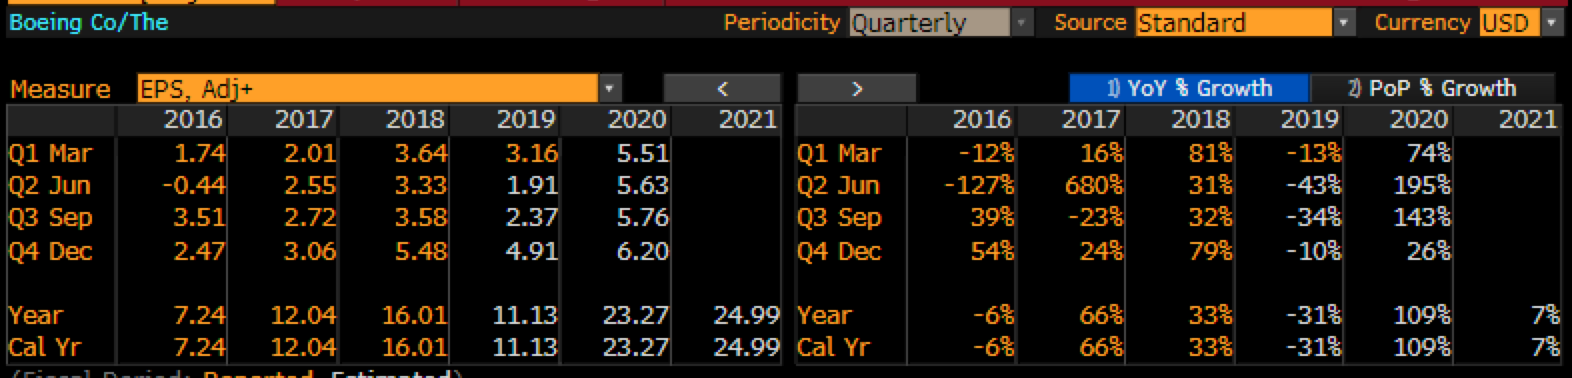
But earnings started to ramp in a major way as the 737 Max got close to its first delivery in Q2 2017, with EPS exploding in 2017 up 66% year over year and up 33% in 2018.
In that year of EPS explosion, shares of BA rose nearly 90% and then again consolidated in 2018, but suffered a 25% peak to trough Q4 decline from an all-time high in early October after one of their 737 Max’s crashed on Oct 29th killing all 189 people on board, and then getting swept up in the Q4 stock market mini-crash.
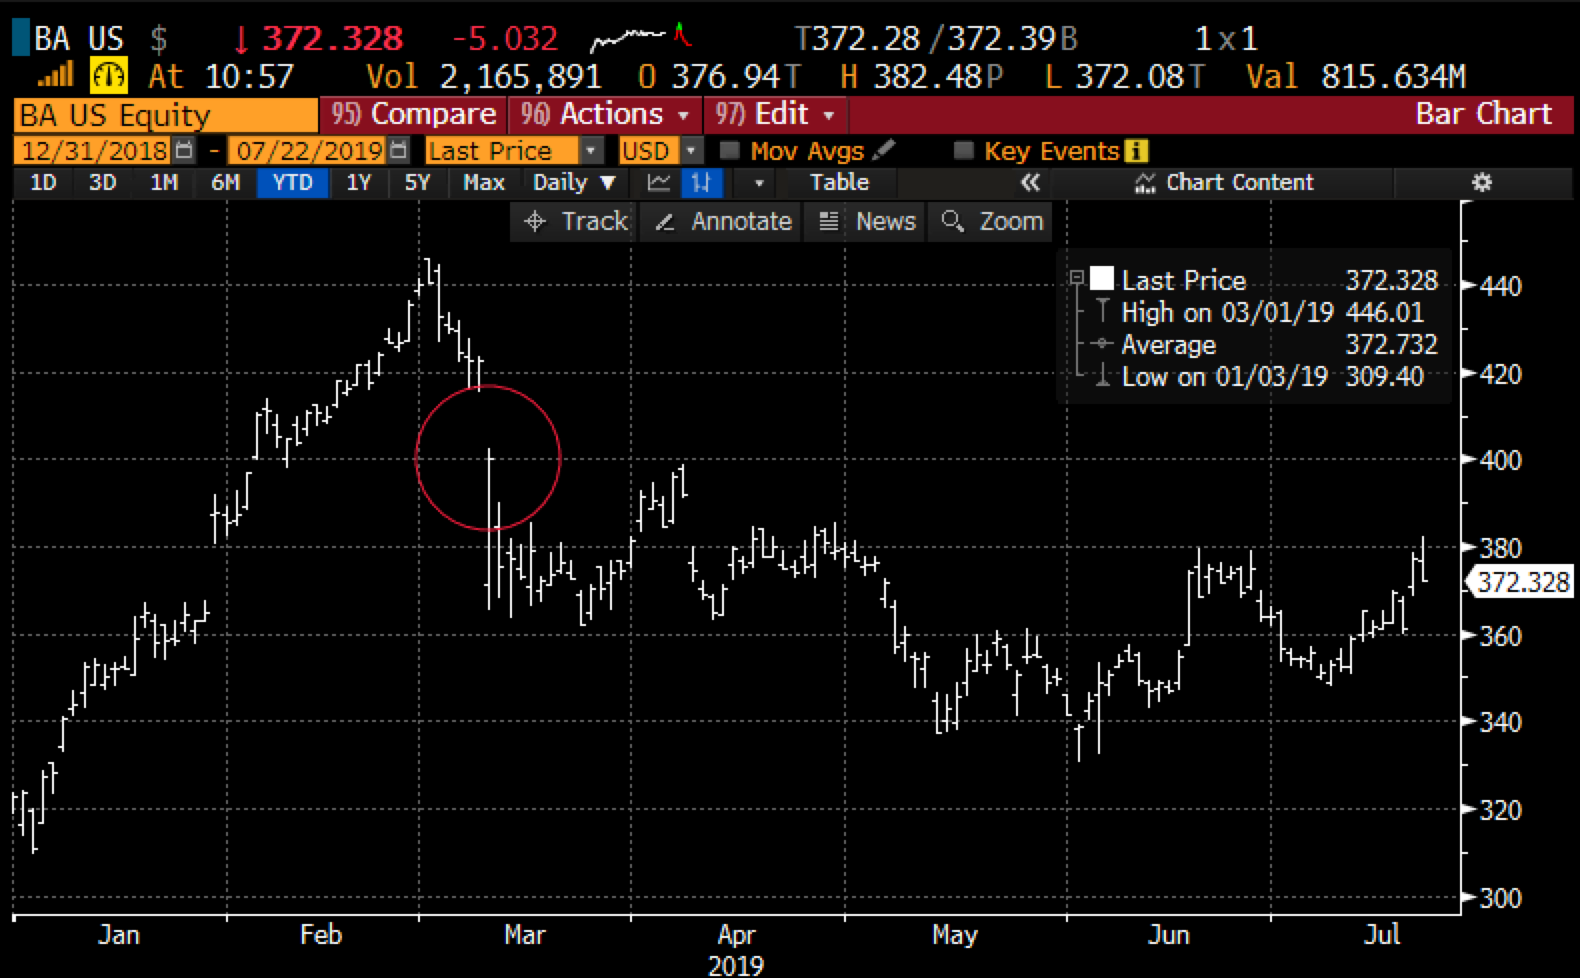
Much like most of the mega-cap stocks, BA shares rebounded sharply in January and February, rallying 40% from its lows to new highs in early March… then very sadly, another 737 Max crash on March 10th, killing all 159 people on board. The stock is miraculously still up 15% on the year, despite it becoming very clear that the company is guilty of some negligence as to the training of pilots on new upgraded systems from the earlier versions of the 737 prior to the Max.
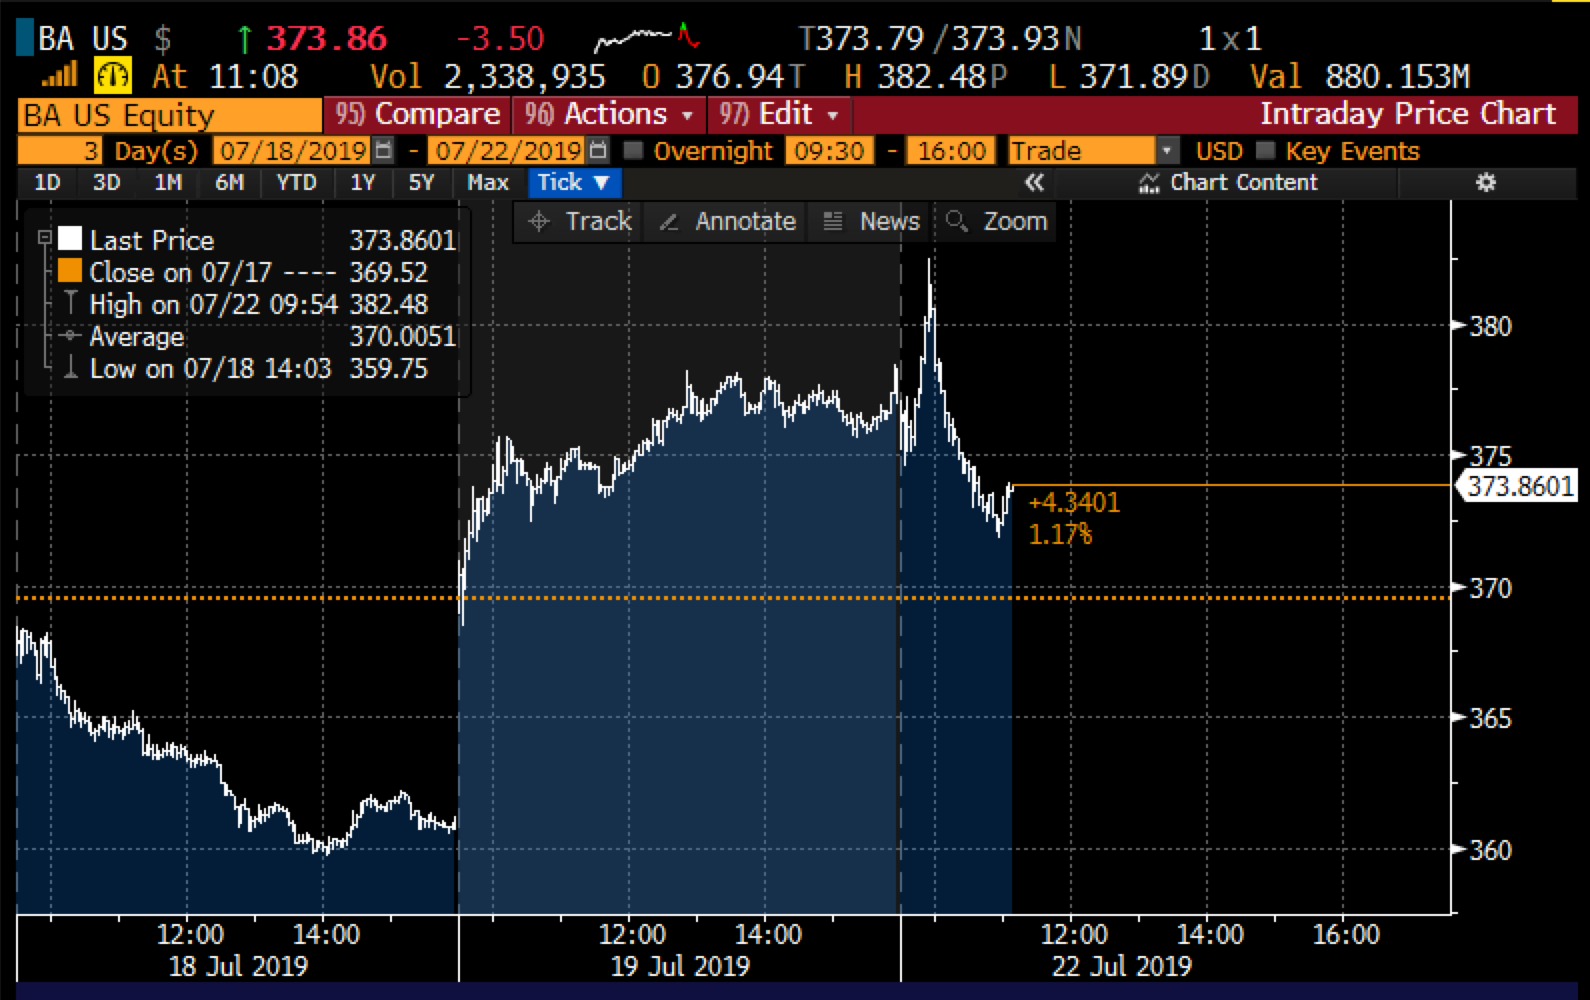
On Thursday the company announced that they would take a nearly $5 billion, ” after-tax charge of $4.9 billion1 ($8.74 per share) in connection with an estimate of potential concessions and other considerations to customers for disruptions related to the 737 MAX grounding and associated delivery delays. This charge will result in a $5.6 billion reduction of revenue and pre-tax earnings in the quarter.”. The stock rallied on the news gapping up 2% Friday closing up 4% and followed through this morning until reversing lower:
This morning Brook Sutherland in a Bloomberg Opinion Column (via Washington Post) writes Boeing’s Charge Is Only the End of the Beginning…
Time and time again during the Max crisis, Boeing has been on the wrong side of conservatism. The two fatal crashes were linked to flight software that was added to help adapt the 737 design to accommodate new, more fuel-efficient engines, raising prickly questions about whether Boeing rushed development of the plane to better compete with the success of Airbus SE’s A320neo family.
…
Some Federal Aviation Administration officials and pilot-union leaders believe the Max is unlikely to fly again until 2020, given the time needed to make all the fixes and coordinate with international regulators,
…
Even with a fourth-quarter return of the Max, that makes me highly skeptical of the company’s assumption that it can not only get back to its pre-crisis production pace of 52 planes per month in 2020, but accelerate that further to 57 jets.
The odds of Boeing’s second-quarter charges being merely a starting point for the financial toll of the Max crisis are high.
Which brings me back to current EPS expectations, which will largely be the driver of the stock’s performance as it is a function of the companies ability to get the Max flying again, keep existing customers from defecting to Airbus ramp orders, etc, etc.
Looking at current 2019 eps estimates, this quarter’s expected sequential decline and what appears to be far more modest declines for Q3 and Q4 it appears as Sutherland alludes to above that expectations for the Max to be back in business and orders, production and deliveries back to business as usual, seem fairly optimistic given the current news flow. Also, assuming that the consensus estimate for $11.13 is about right, analysts expect a massive recapture to the 2019 eps losses originally expected to call for 109% eps growth next year. Seem like there is a tad amount of hope built into these estimates.
So what’s the trade?
BA is set to report Q2 results on Wednesday, July 24th before the open. The options market is implying a $12.50 move in either direction or about 3.3%, which is rich to the 2% average one day move following the last four quarters, but generally in-line with the long term average.
If the implied move is $12.50 then that means picking a direction and getting at the money exposure for earnings is half that, thus buying a put if bearish or a call if bullish one would risk less than 2% of the stock price. I might even leg into a put spread in August giving myself some more time than just the earnings event, the Aug 370 puts at $9ish look like a good buy if you thought that worse than expected 2nd have guidance will cause downward earnings revisions in the coming weeks.
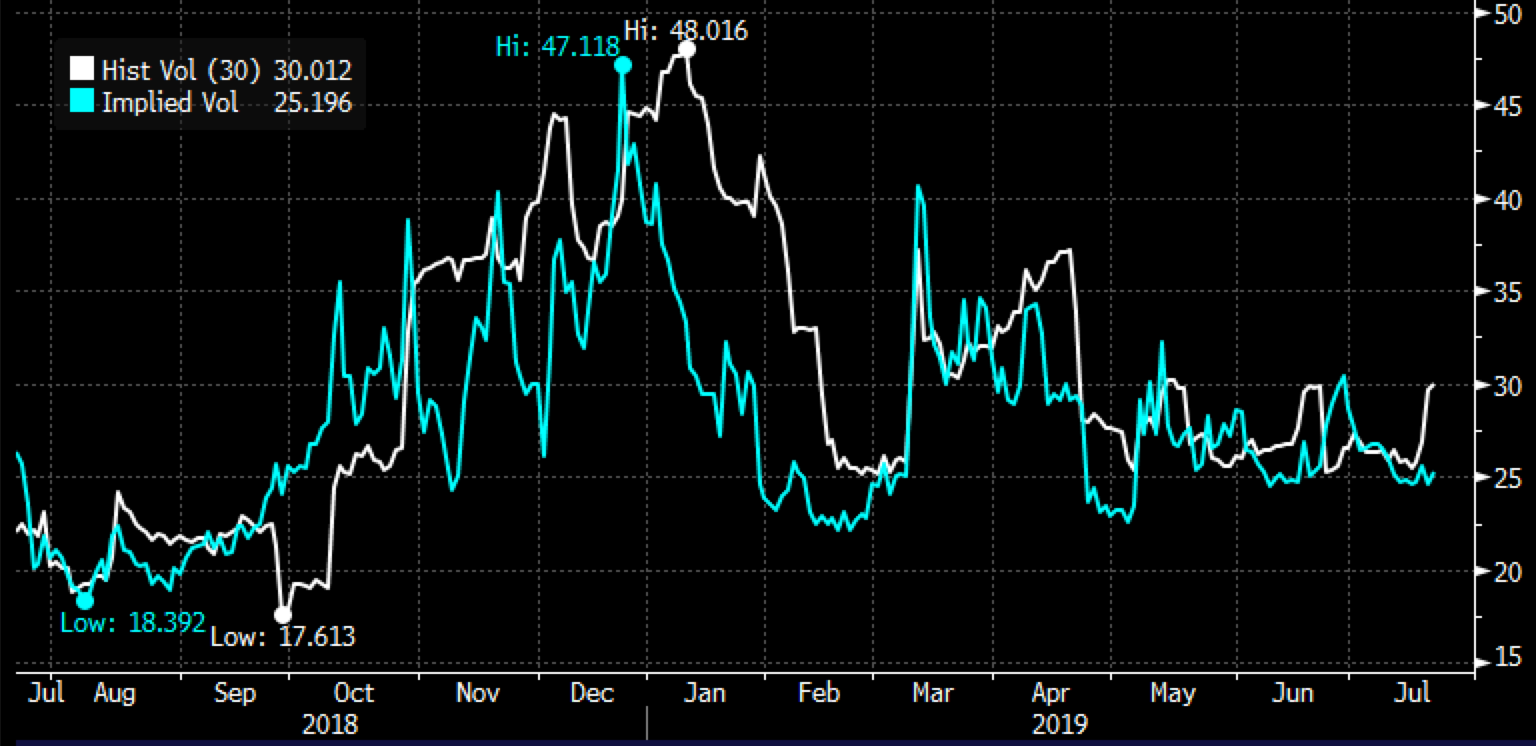
Short-dated options prices are surprisingly low in my opinion into the print, with 30-day the money implied volatility (the price of options, the blue line below) at just 25% vs realized volatility (how much the stock is moving, the white line below) at 30%, reinforcing the relative cheapness, especially considering the uncertainty about forward guidance:
Hedge Vs Long Stock:
If I were long the stock, thinking that new highs are a ways off until more clarity, but worried about headline risk and the stock re-testing $300 in the coming months, but don’t want to sell my stock, I might consider a collar, selling an out of the money call and using the proceeds to buy an out of the money put, allowing for upside in the stock to the short call strike-through expiration, with profits capped at the call strike, losses down to the long put strike till expiration, but protected below… for instance…
vs 100 shares of BA long at $373 Buy Sept 400 – 340 Collar for even money
-Sell to open 1 BA Sept 400 call at $4.35
-Buy to open 1 Sept 340 put for $4.35
Break-even on Sept expiration:
Gains of the stock up to $27 between now and Sept expiration, profits capped above. On or before Sept expiration investor could always cover the short call strike if the stock is at or above 400 to keep the long position intact.
Losses of the stock of up to 33 down to the long put strike. Protected below
Rationale: an investor would do this if they did not want to sell their long position and are more worried about extreme downside near term then they are about extreme upside. Most importantly willing to suffer losses down to 340 and have gains capped at 400 between now and Sept expiration.
I know I know, about 20 minutes ago you were saying to yourself… Land the Plane Dan!