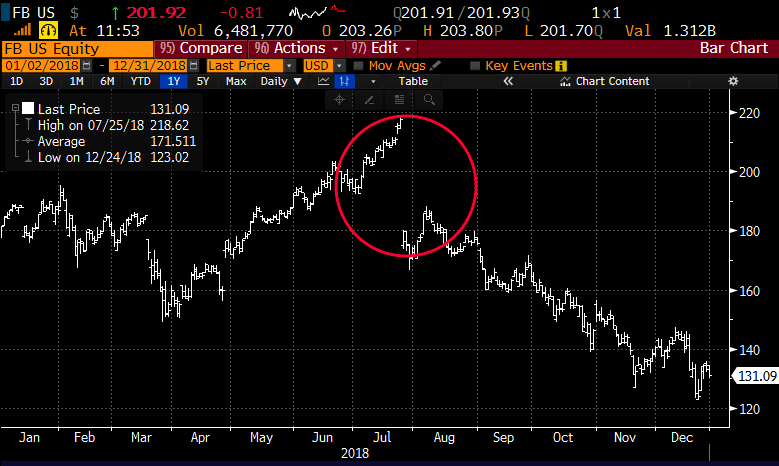
Last summer, following Facebook’s (FB) disappointing Q2 results and forward guidance, the stock suffered the worst one-day loss in market cap terms ($119 Billion) in the history of the U.S. stock market on July 26th, 2018 collapsing 19%, from an all-time high, which would ultimately result in a nearly 45% peak to trough decline into the year-end, and closing down 26%:
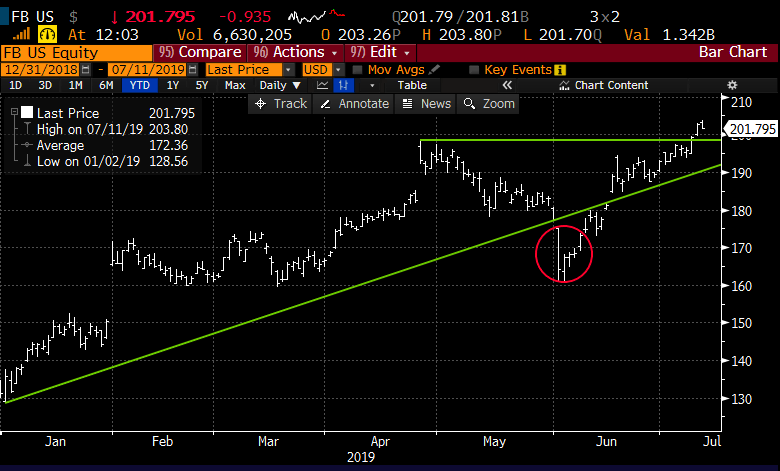
Oh what a difference the change of year can bring, FB’s stock’s low tick of the year essentially came on its opening tick of the year and Jan 2nd and has never looked back really with the stock up an eye-popping 54% YTD. The chart below shows the orderly uptrend for most of this year, excluding the early June collapse from $180 to $160 in two trading days following the news that the FTC is likely to investigate the company for “anti-competitive practices”. The stock has since rallied 25% in a little more than a month, and this morning making a new 52-week high:
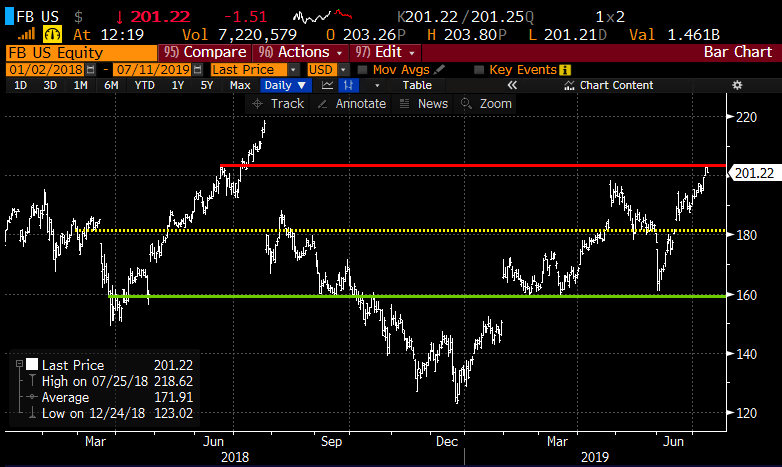
Put those two charts together over the last month and you see a stock that likely has decent technical resistance in and around $200, healthy near term support at $180 and very good support at $160:
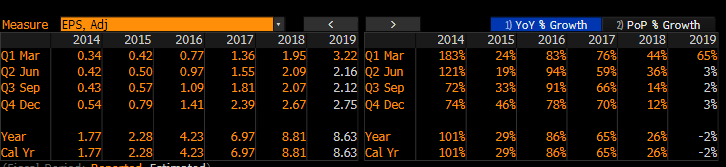
So here is the deal, last July FB management guided down on greater costs associated with beefing up policing of their platform which resulted in a fairly dramatic deceleration in eps growth from 65% in 2017 to 26% in 2018 with consensus estimates calling for a 2% year over year decline in 2019.
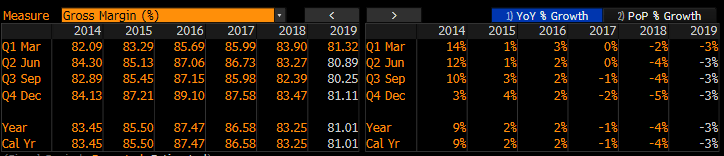
Gross margins have gone from a peak of 87.47% in 2016 when their platform was being flooded with Russians ads seeking to influence our election to the expected 81% this year:
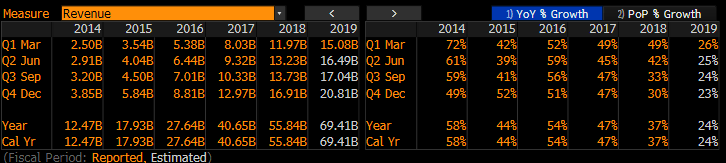
Despite the fact that sales growth is also decelerating it is worth noting that is to be expected for a company what has grown dales from $5 billion in 2012 the year that the company went public to an expected $69 billion this year, up a whopping 24%!
The obvious takeaway is that advertisers and users who engage with advertisements on FB’s platforms have not fled their properties and that there is a distinct possibility that the costs associated with making FB a “safer-place” cause increased engagement resulting in higher ad revenues.
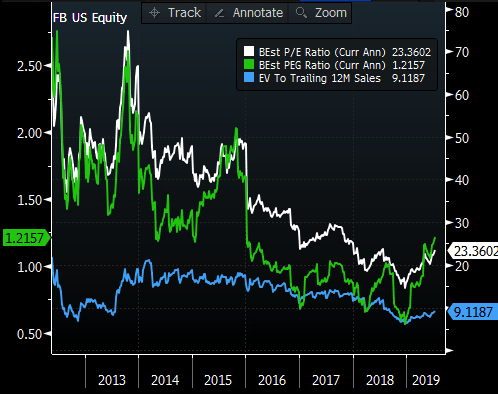
The stock is trading very near recent all-time lows on valuation metrics like P/E, P/E to Growth and EV to Sales Basis:
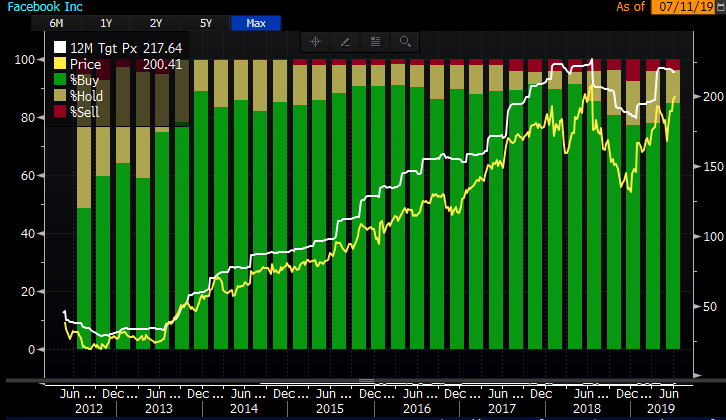
Which is one reason that Wall Street analysts have not abandoned the story, in fact, they remain very bullish with 46 Buy ratings, 6 Holds and only 2 Sells, and even at the stock’s lows earlier this year the % of Buy ratings only briefly dipped below 80%:
The next identifiable catalyst for shares of FB will be their Q2 earnings on July 24th, the options market is implying about a $13.50 move in either direction between now and the close on July 26th, or about 6.75%. With the stock near $200.60, the July 26th weekly 200 straddle (the call premium + the put premium) is offered at about $13.50, so if you bought that, and thus the implied movement between now and July 26th, you would need a rally above $213.50 (very near the all-time high last summer) or below 186.50 to make money. Obviously, if you were inclined to pick a direction between now and then, the at the money call or the put is a little less than $7 each.
We will be sure to preview the quarter prior to results.