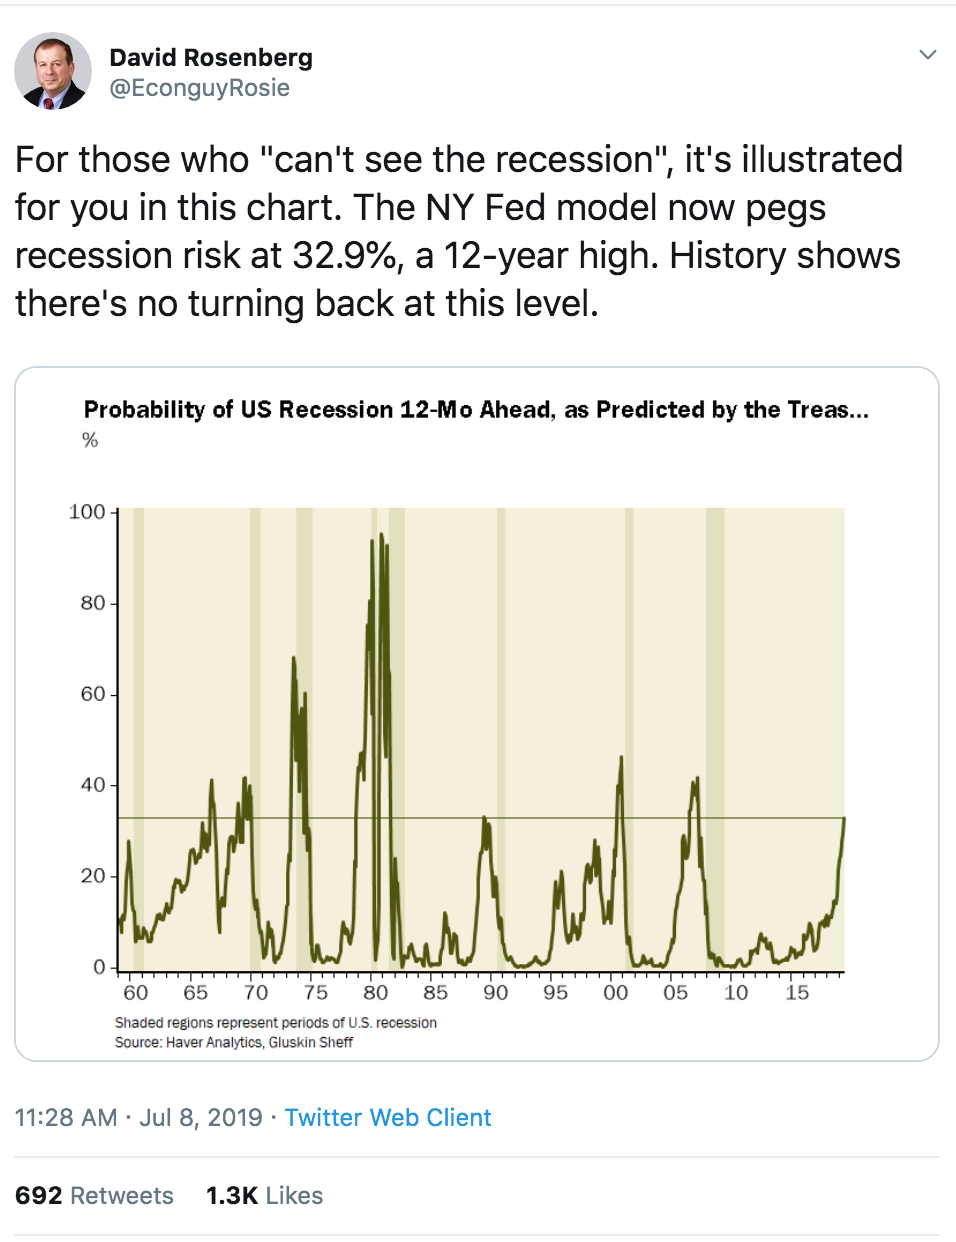
Yesterday, noted stock market bear, David Rosenberg, strategist at Gluskin Sheff highlighted on Twitter data from the NY Federal Reserve on recession risk:
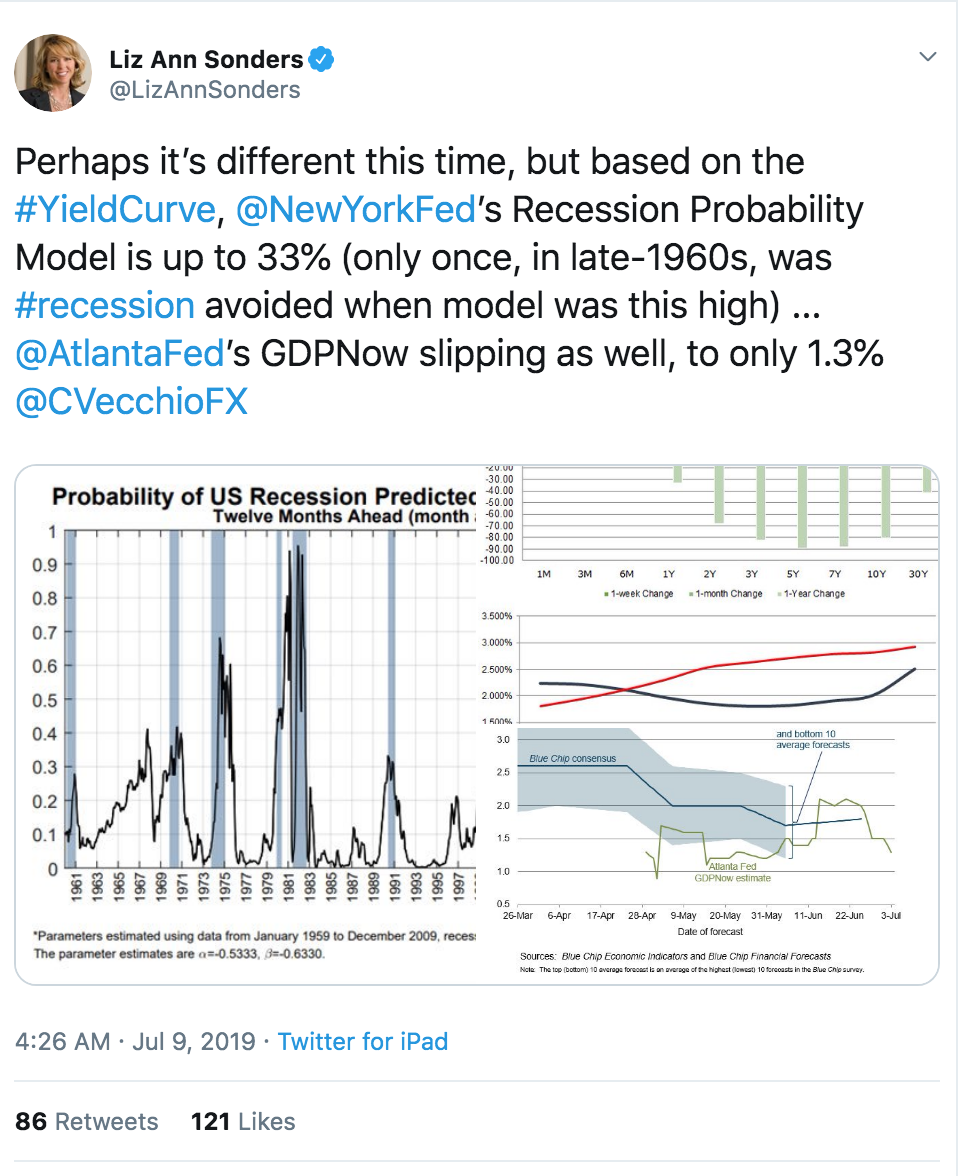
Interestingly this morning, noted stock market bull, Liz Ann Sonders, Chief Equity Strategist at Charles Schwab took a crack at the same data from a different angle, also on Twitter:
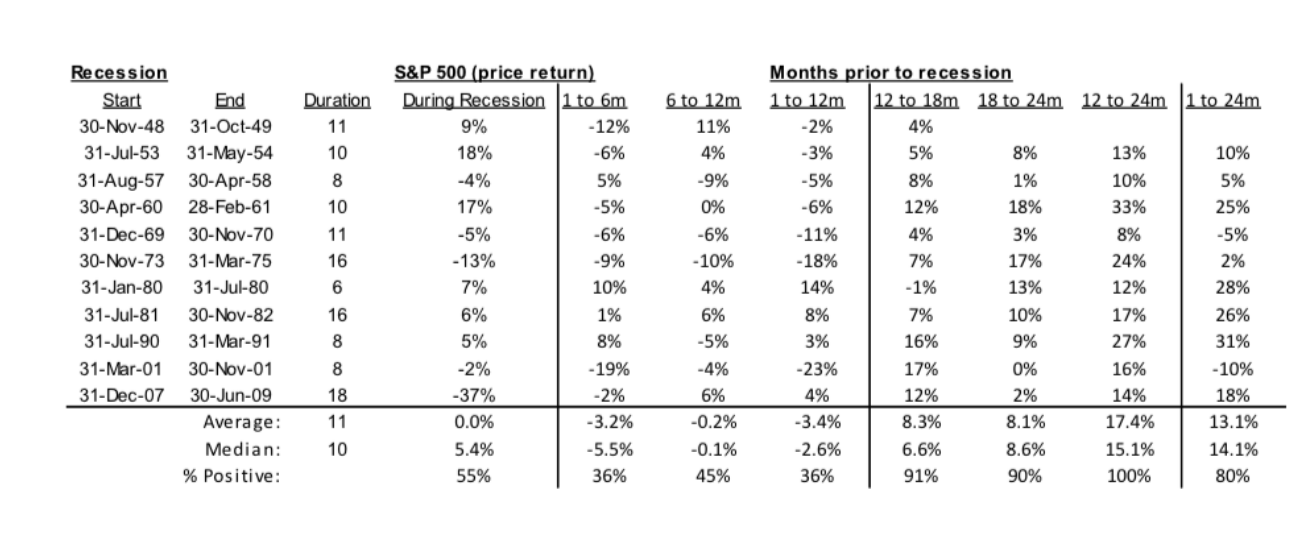
Why all this focus on recessions as we know the economy is not the stock market, but expectations for economic growth are usually one of the most important inputs into the stock markets valuation and a huge driver of investor sentiment. The website SeeItMarket broke down the price performance of the S&P 500 during the last 11 recessions since the 1940s:
There have been eleven recessions since the late 1940s, coincidentally with an average duration of eleven months (table below). Interestingly, the average price return of the S&P 500 during these recessions was around 0%. Now much can be hidden in an average. The last recession (aka global financial crisis) had markets down 37% once the recession started until it ended. But during others, the market actually rose. In fact, in six of the eleven recession the S&P 500 rose.
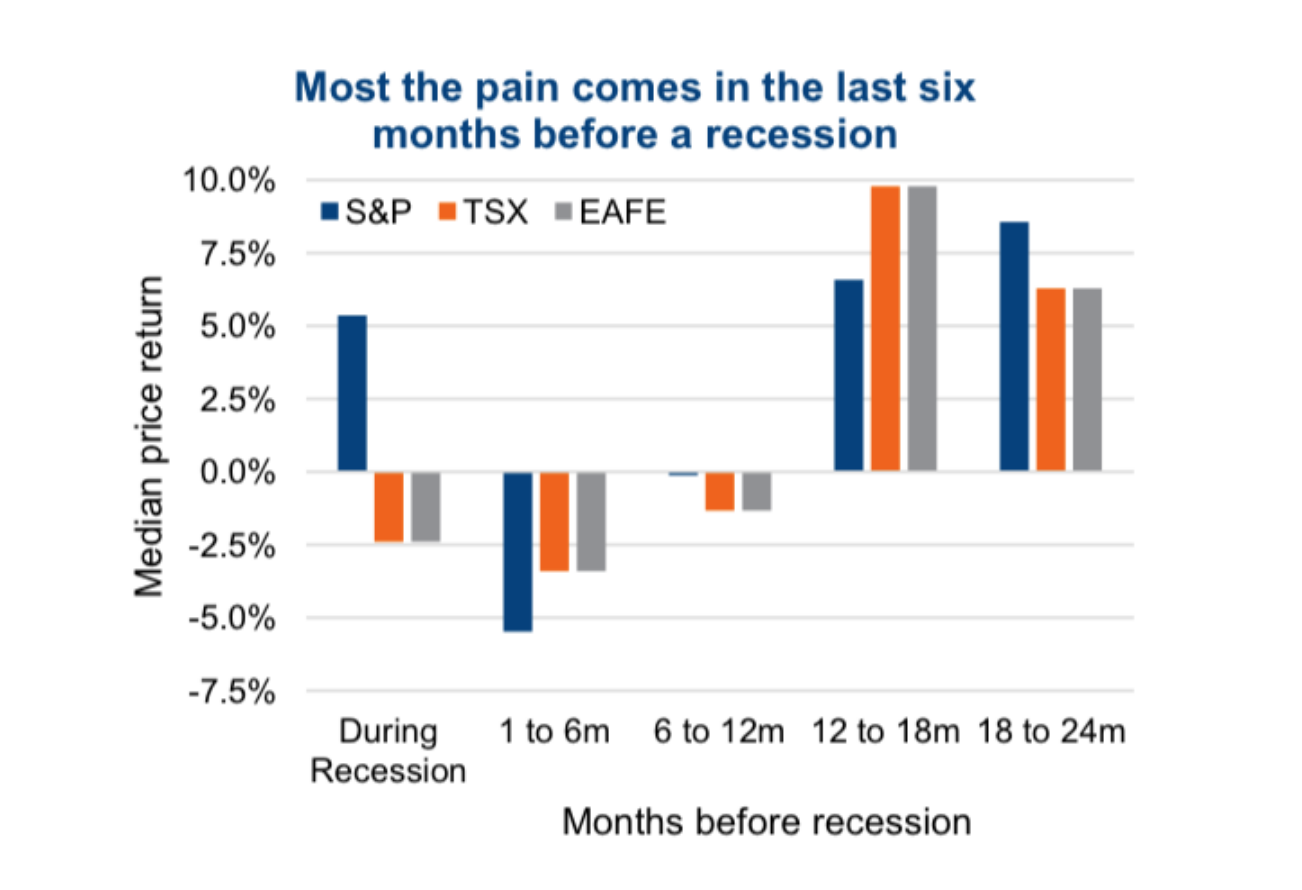
What this tells me is that the stock market starts to discount recessions prior to them happening, which SeeItMarket details with the price-performance in the last six months prior to a recession and then on the way out:
In many cases most of the pain is felt before the recession actually begins. We measured the S&P 500 price performance in various periods approaching recessions and found the six months just before to be a bad period for equities. This obviously supports the view that equity markets are a bit more forward looking especially compared to economic data which is often a bit backward looking.
Here is the thing, it is virtually impossible to call the timing of a recession as it is virtually impossible to call a top in the stock market, but when bulls and bears alike start coming to similar conclusions about data sets that point to likely outcomes it is worth taking note.
And stocks in the U.S. just had their best first half of the year since 1997, which the WSJ notes is usually a good sign for the second half of the year:
The S&P 500 ended June up more than 17% from the beginning of the year, marking one of 12 times since the index’s inception that it climbed 15% or more in the first half. Data shows that when the first six months have produced gains this large, stocks have always finished the year in the black.
Whenever the S&P 500 climbed 15%-18% in the first half, the index continued to rise in the next two quarters—albeit posting smaller gains, according to Dow Jones Market Data.
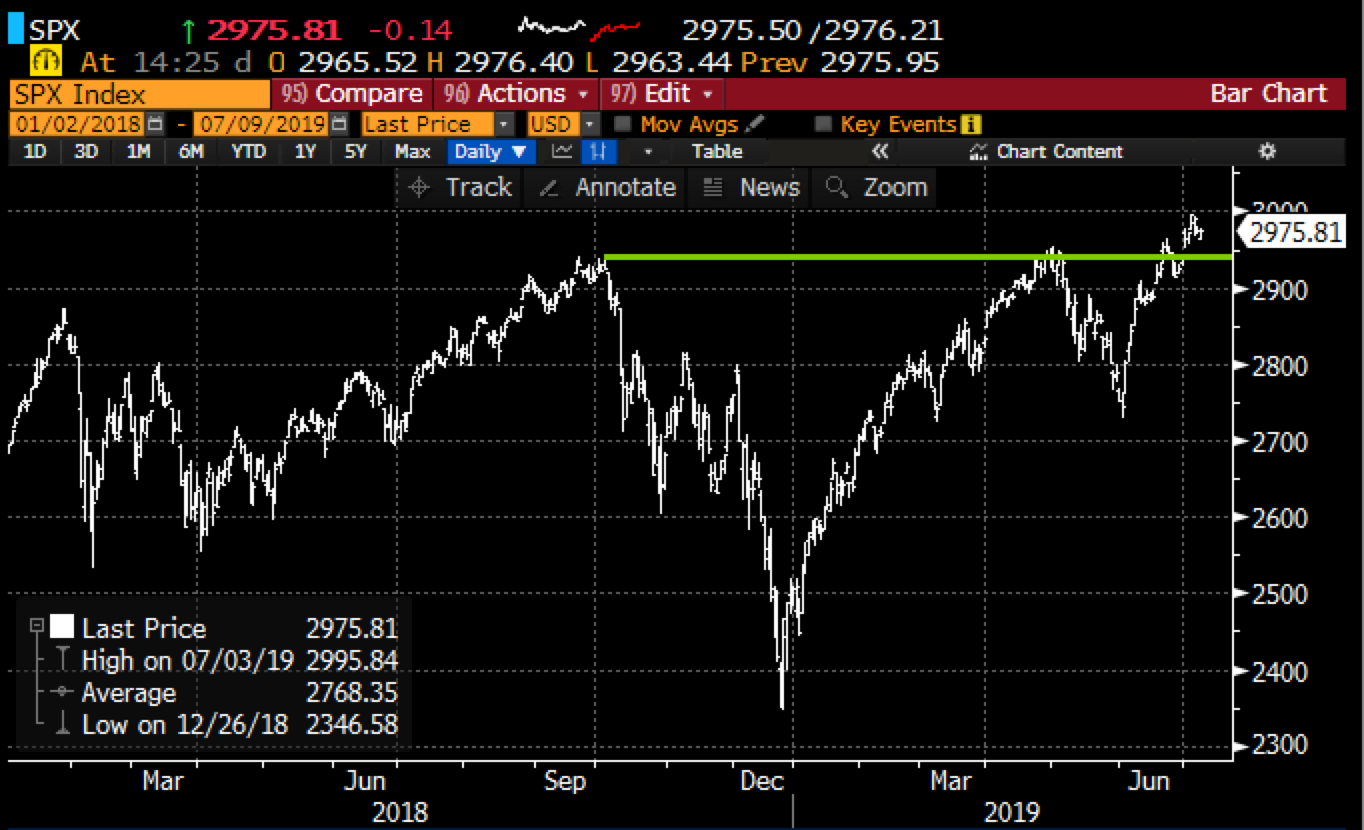
So the market has that going for it, which is nice. The S&P 500 (SPX) above what many (including me) might have thought was an epic double top in the index from Oct 2018 & Apr 2019 is starting to have a sort of defensive feel to it:
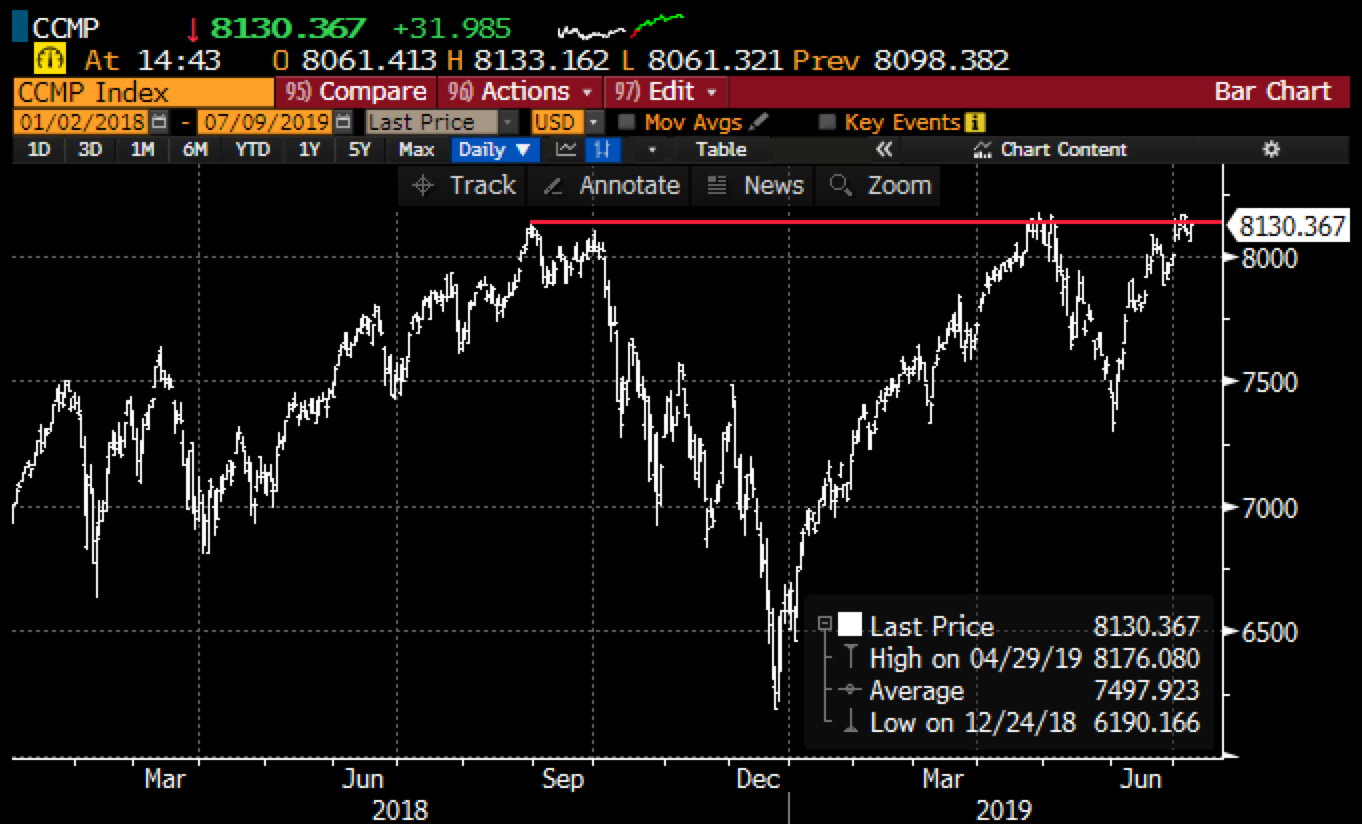
Which makes the Nasdaq Composite’s pause at its Aug 2018 & April 2019 highs all the more interesting, as increased breadth would only make the bull case for a sustained second-half rally all the more likely, with prior technical resistance becoming support:
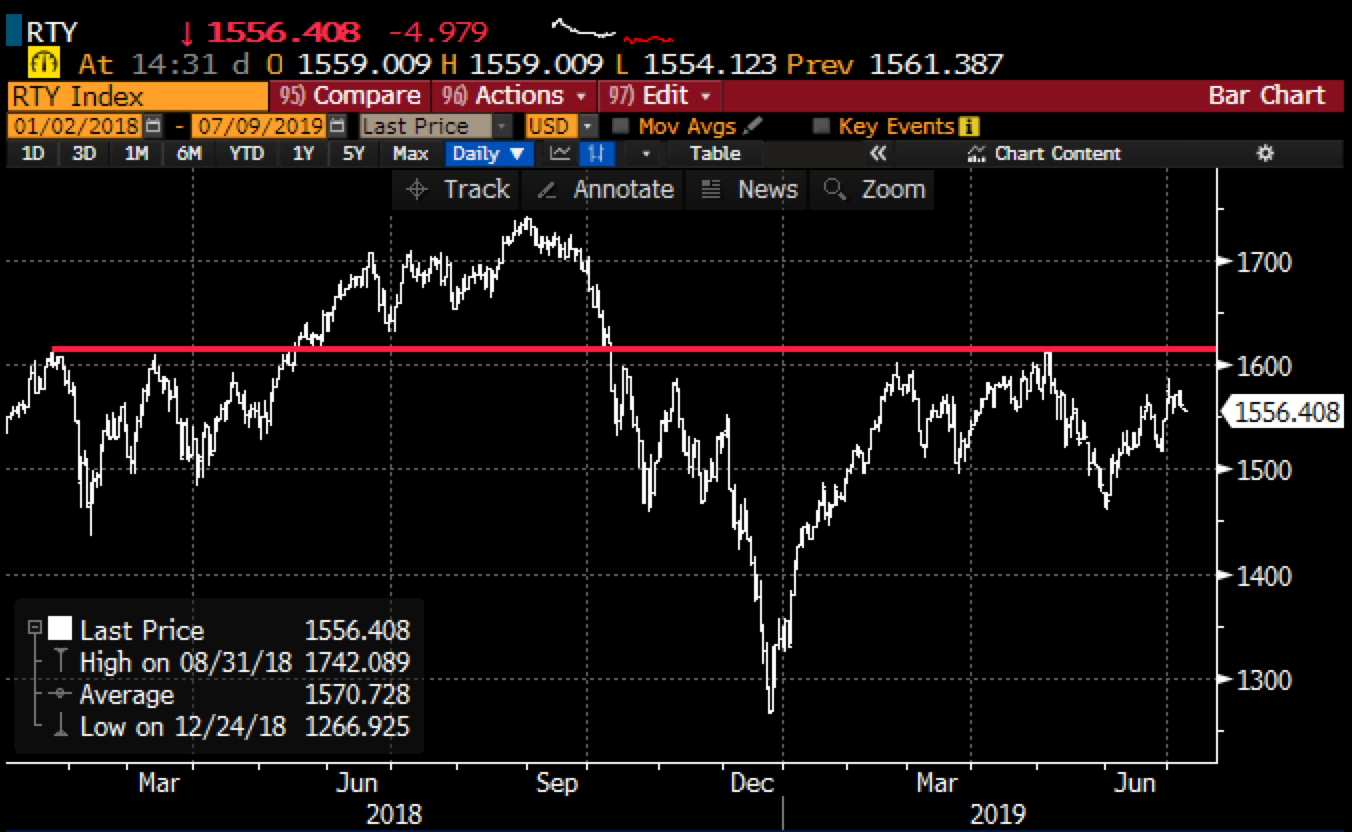
It is worth noting again that the small-cap stocks as measured by the Russell 2000 can’t get out of their own way, down 10% from its 52-week highs made in 2018:
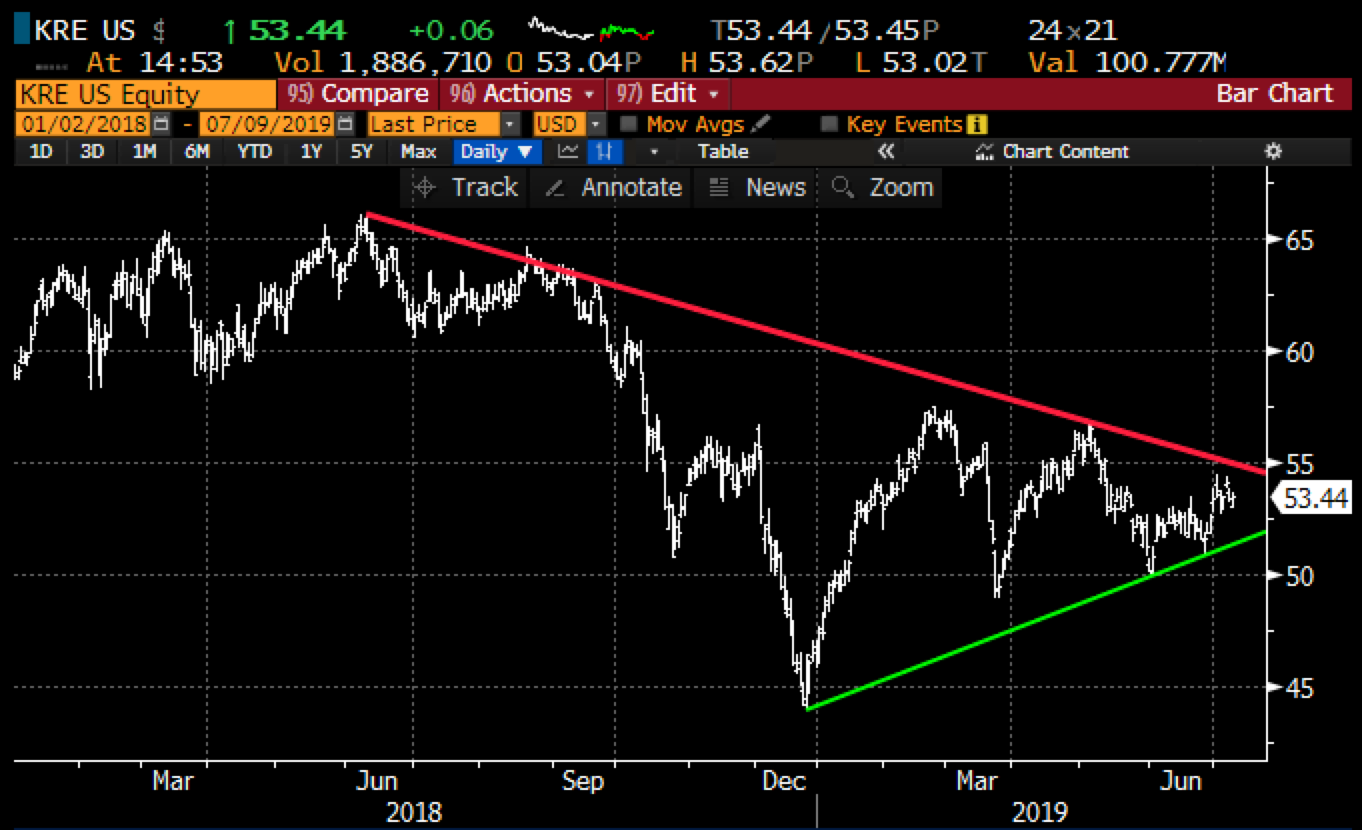
I would also add that just looking at the new highs in the SPX and CCMP one might think that the U.S. economy must be roaring, but as I started the post, strategists are starting to consider just how quickly a recession might hit. But if we were to look at what many think is the lifeblood of any healthy economy, bank stocks, both here and in Europe, one might think twice about just how long we have before GDP turns negative. The KRE (U.S. Regional Bank Index), which might be one of the worst looking sector charts in the U.S. market:
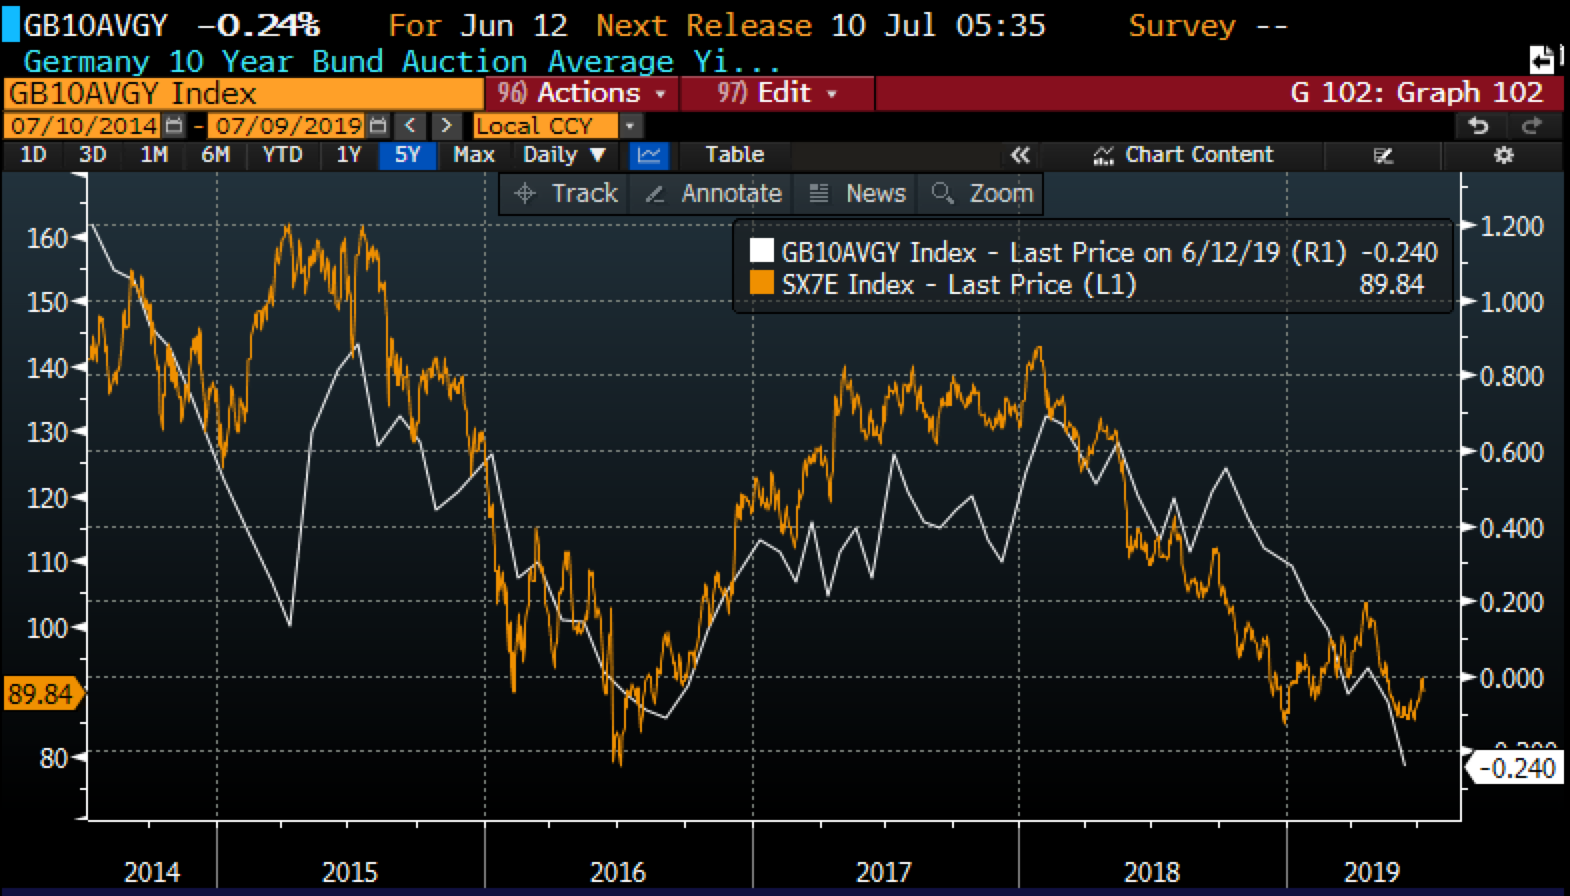
Then, of course, there is the Euro Stock Bank Index, SX7E, when overlaid with the yield on the 10Yr German Bund, which is negative, and part of the $13 trillion (and growing) Sovereign Debt in Europe and you start to get a sense as the U.S. might be on the brink of a rate-cutting cycle that the lifeblood is losing oxygen quickly. The five chart below (the time period since the supposed end of the Euro Debt Crisis) overlaid with one another shows very clearly that NIRP has NOT been good for bank stocks:
SO WHAT”S THE TRADE?? Well I don’t really have one, On June 27th in a post-titled G-20 – Likely No There There I highlighted just how cheap short-dated options are in the SPY, the etf that tracks the SPX:
To put this in some context, the July 292 straddle (the call premium + the put premium) are offered at $8, implying movement of 2.7% in either direction between now and the close on Friday, July 19th, a rally above 300, or a decline below $284.
Put another way, if you wanted to make a little less than a 1 month bet that will capture this weekend’s G-20 and a whole bunch of earnings in mid July, then buying either the at July 292 call or put for just $4, or 1.3% of the etf price seems like a fairly cheap way to do it. At this point, it makes little sense to start with a spread if you were to buy the at the money put and call and it starts going in your direction you could always sell a higher strike call or a lower strike put to lock in some of the gains.
As I write the SPY July 292 straddle with the ETF at $296.85 is trading at about $6, the put losing most of its value and the call which is $4.85 in the money trading at $5, basically like stock. Now with just 8 trading days to July expiration, the July at the money 297 straddle (the call premium + the put premium) is offered at $3.20, or less than 1.5% of the etf price… I highlight this because of an 8 day at the money purchase of the call or put costs less than 1%… DOLLAR CHEAP!