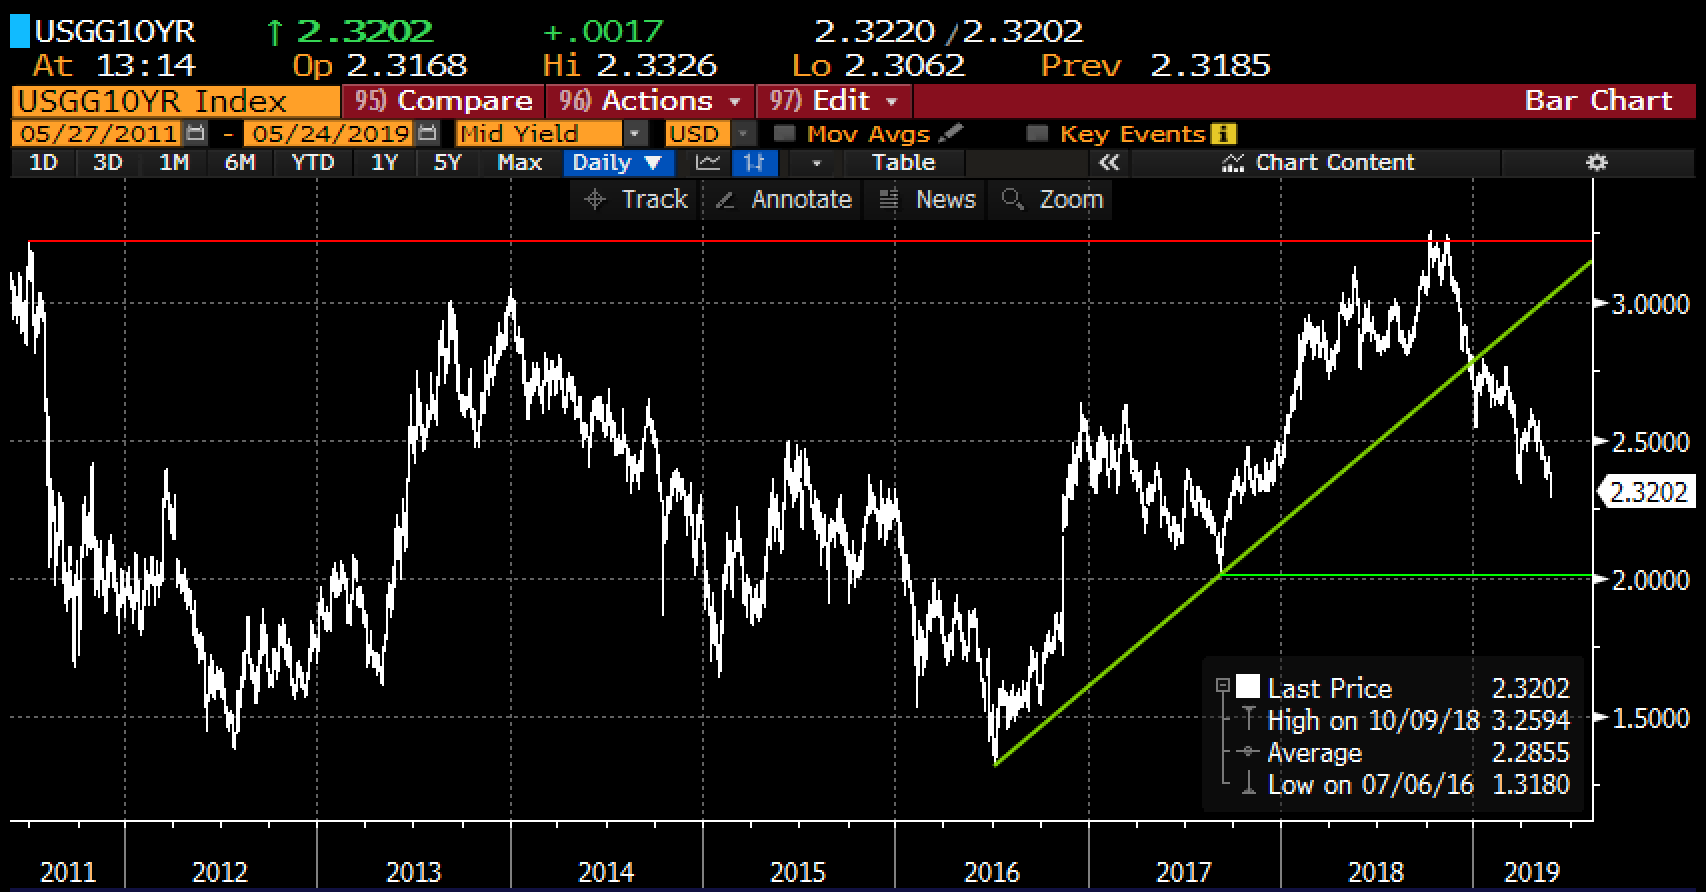
Mortgage rates this past week fell for the fourth consecutive week, with the 30-year fixed now at their lowest levels of 2019 round 4.06%, well below the average of 4.66% a year ago. You know the drill, the 10-year Treasury yield has gone from a multi-year high in early October, down almost a full percentage point since, possibly on its way back to 2%:

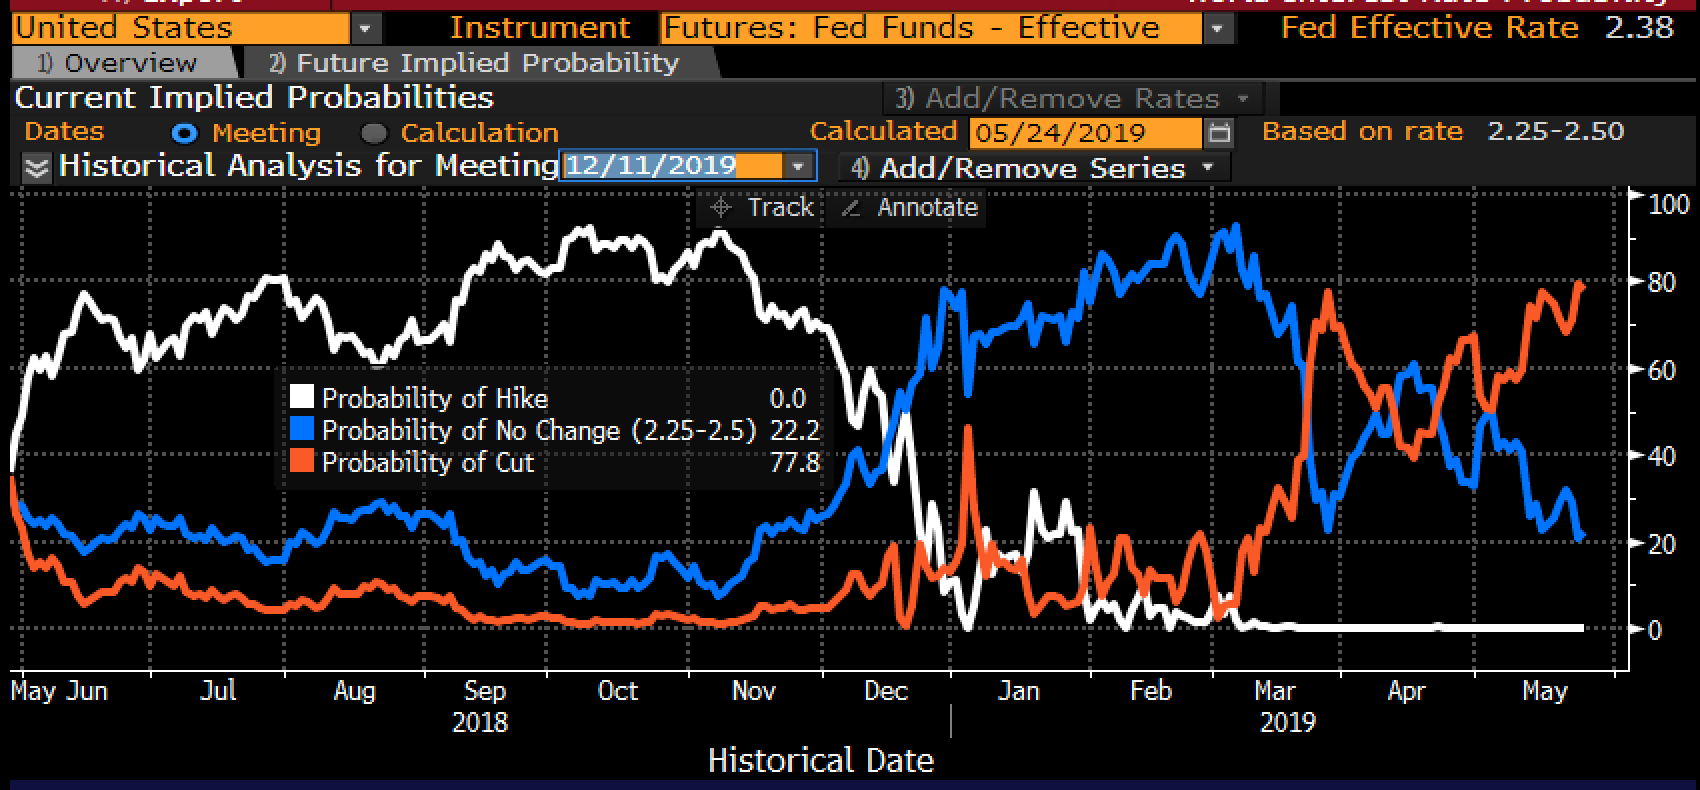
Back in October, Fed Funds futures were still pricing the prospect of at least three quarter-point rate hikes over the next year, but only got one in December and now Fed Funds futures are pricing the probability of a cut at the Dec 11th meeting at nearly 80%, while the probability of no change is just above 20%, a fairly stark reversal in a very short period of time:

Usually declining mortgage rates are a good thing for home sales, but maybe the reason for the precipitous drop in Treasuries and mortgages is that the reason Fed Funds is between 2.25 and 2.5% and likely to go lower in the coming months is not the sort of reasons that make consumers want to go out and buy homes… maybe this cycle the 10-year Treasury topping out at just below 2.5%, vs 5.5% in 2007 and 6.5% in 2000 is telling us that the next recession might have something totally new in store for.
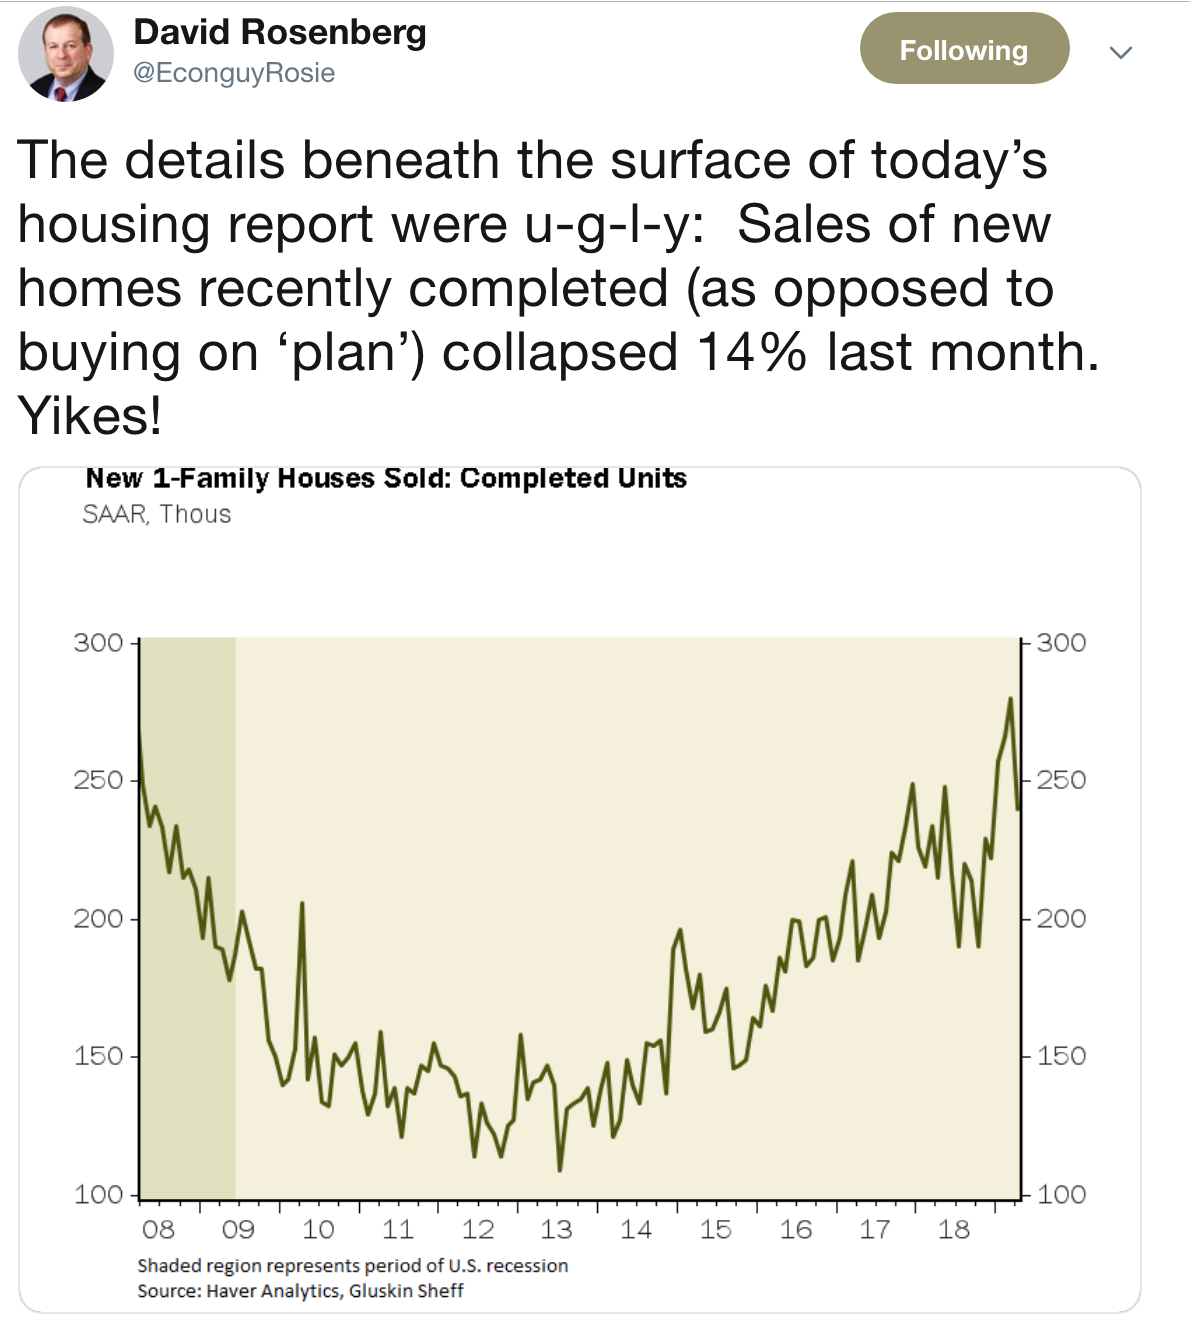
Which brings me to yesterday’s new homes sales data for April, summed up by David Rosenberg of Gluskin Sheff’s tweet this morning:

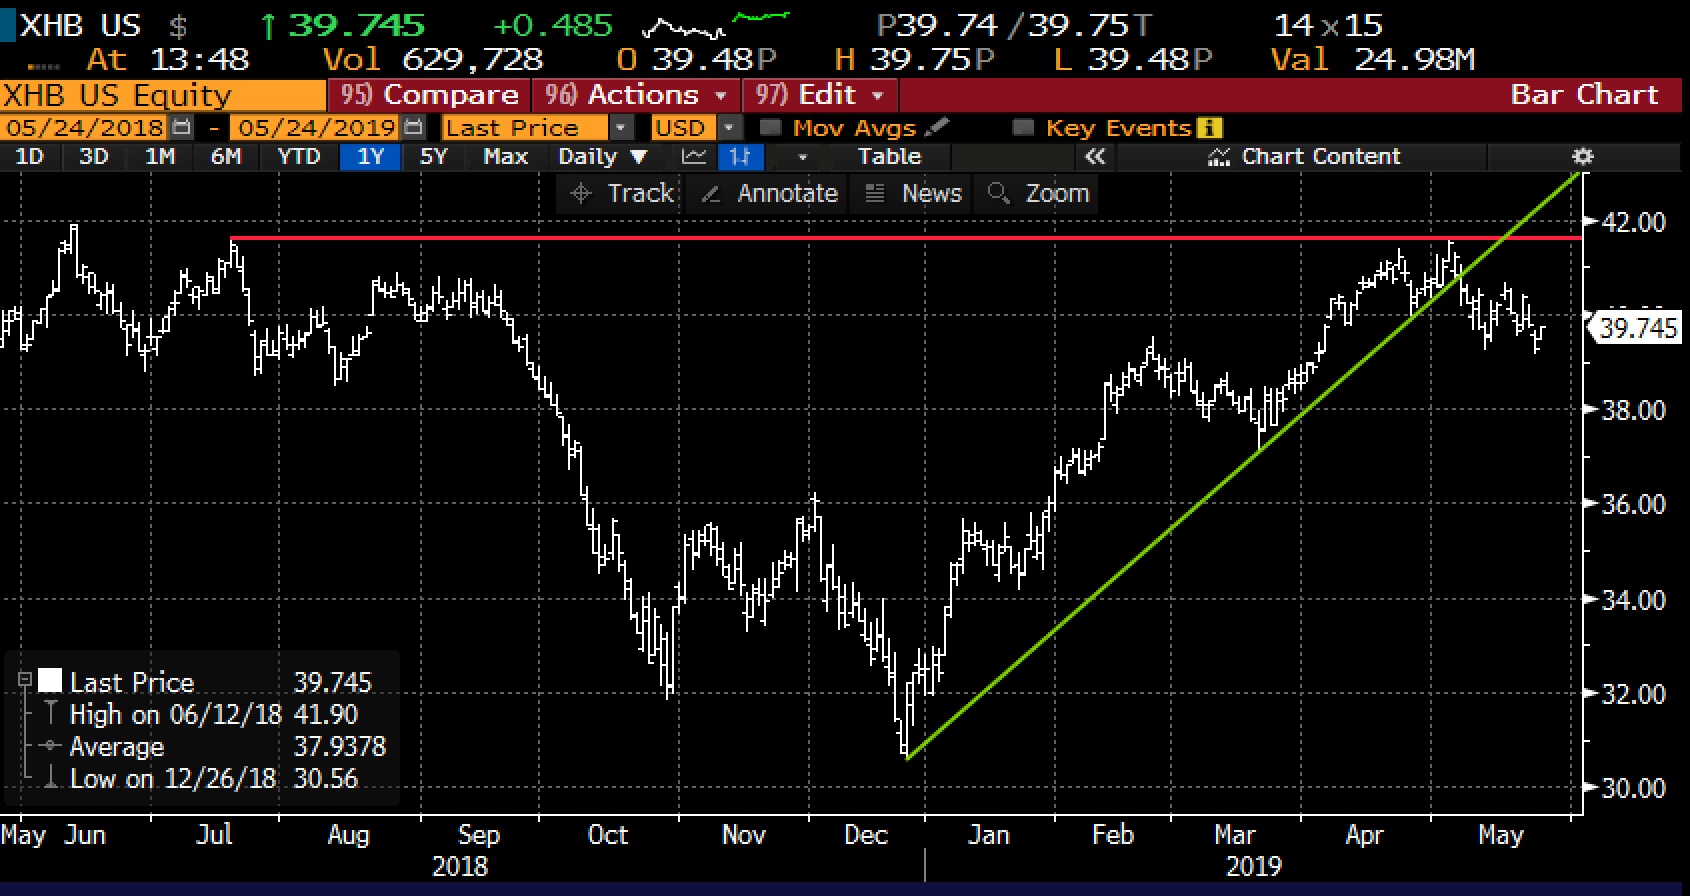
Back in early November, I highlighted my Friend Tom Lee’s view, supported by 20-year data that the housing group outperforms the S&P 500 meaningfully from mid-Oct to late April (read: Home is Where the Heart is?). At the time my view was that sentiment was so poor in the face of rising rates, valuations so low, and the stock’s so beaten up that it made sense to take a defined risk show to the upside over the period described by Lee. Now maybe the opposite is true with the XHB, the S&P Homebuilder etf up 30% from its 52-week lows made in December, vs the S&P 500’s (SPX) 20% gains in that same time period. WIth rates going lower for what should be the wrong reasons for homebuyers, it might be time to take the other side of this trade. But to be clear yesterday’s data was specifically bad on the low end for homes $250,000 and below, but pieced together with some recent data about credit card delinquencies rising to levels not seen since 2011, and some data about the adverse effects of the on-going trade war with China, specifically on consumer goods like April’s 17.% year over year decline in major appliances, and we might have the ingredients for the start of a consumer led-recession.
Which brings me back to the XHB, which earlier this month failed to make a new high with the SPX, and has actually broken below the uptrend that had been in place from the 52-week low made in December:

So what’s the trade? If you were inclined to make a bearish bet against homebuilders because you think that the US consumer is showing signs of strain, then housing stocks are likely one of the first casualties, despite the trajectory of interest rates.
Bearish Trade Idea: XHB ($39.75) Buy Sept 40 / 35 put spread for $1.25
-Buy to open 1 Sept 40 put for 1.75
-Sell to open 1 Sept 35 put at 50 cents
Break-even on Sept expiration:
Profits of up to 3.75 between 38.75 and 35 with max gain of 3.75 at 35 or lower.
Losses of up to 1.25 between 38.75 and 40 with max loss of 1.25 at 40 or higher
Rationale: this trade idea risks about 3% of the etf price with a break-even down 2.5% because it is already slightly in the money, with a max potential gain of $3.75 or almost 10% of the etf price offering a potential payout of 3x the premium at risk.