The broad market, along with Auto stocks globally jumped on a headline that the trump admin plans to delay previously planned tariffs on cars entering the country by six months, per CNBC.com:
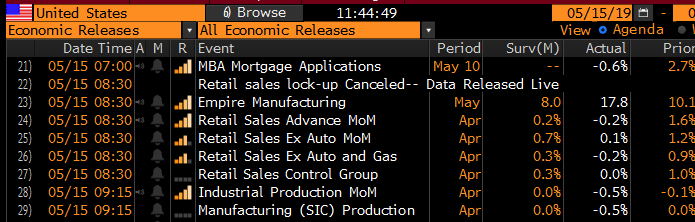
These headlines came just a couple of hours after some economic data related to U.S. retail spending and industrial production missed estimates for April, per Bloomberg:
It might make sense to take a look at Ford (F)… thinking back a couple of weeks about their Q1 results that yielded a one day gain of close to 11% on April 25th, the day following after investors cheered the companies results benefitting from its ongoing restructuring, also “credited its better-than-expected performance in North America to strong truck and sport utility vehicle sales there, particularly its F-Series and Ranger pickups”… watch Ford CFO Bob Shanks discuss the results on April 25th:
The one day gap on April 25h placed the stock above an important technical level at $10 which was a key breakdown level last summer that once broken yielded and additional 25% decline into the Dec lows:
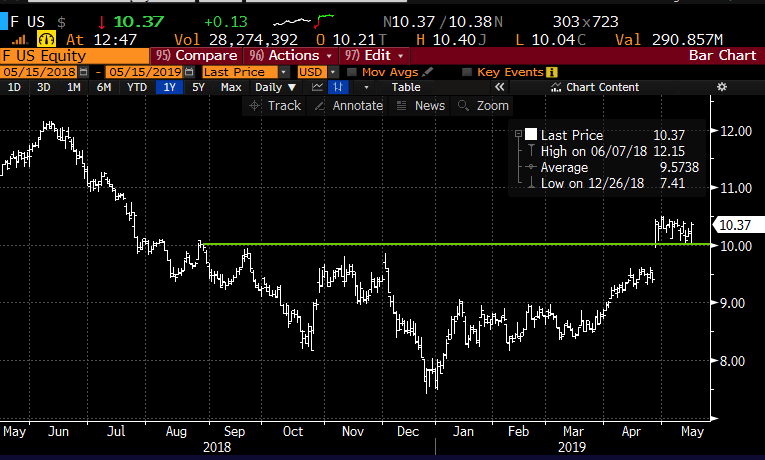
A real technician like my friend Carter Braxton Worth of Cornerstone Research might call that a bearish to bullish reversal, on massive volume.
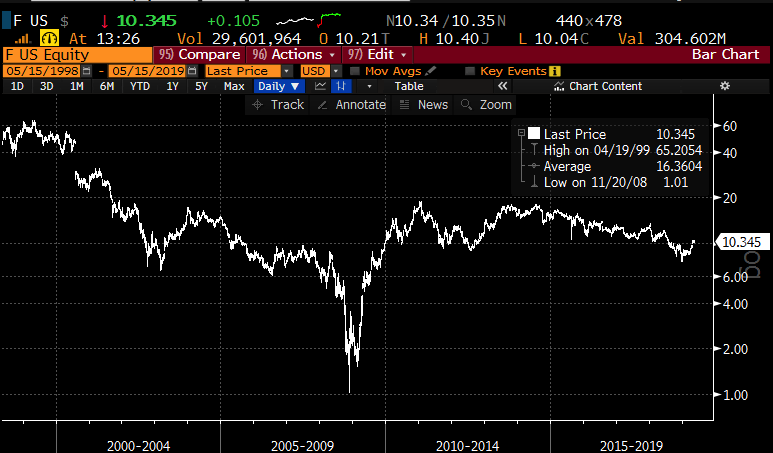
But taking a longer-term view, it becomes very clear, no matter how you choose to draw the lines that Ford has been a very well defined multi-year downtrend:
Is this the breakout that sticks? Your guess is as good as mine, but I suspect it would take a confluence of events for this stock to get back to the mid-teens this year i.e. the resolution of all trade disputes in North America, Europe, and Asia, which would hopefully result in a reacceleration of global growth, further cost savings from their restructuring and continued strength in trucks & suv’s in the U.S.
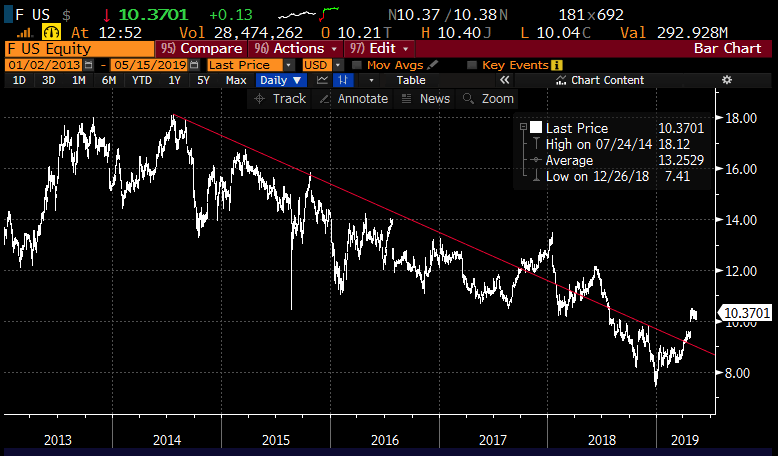
But if these trade disputes depress global growth at what appears to be a fragile time for the global economy and we do have a global recession, then Auto companies are likely to be ground zero for the fall-out. The 20-year chart below might have two different looks depending on your thoughts on global growth over the next few years and the potential for another financial crisis or bear market like we saw from 2000 to 2003 and 2007 to 2009… I see either an epic head and shoulders bottom or a chart that does not have real support for another 40%:
Let’s not forget that while most every other major auto company reorganized in the wake of the financial crisis (remember GM – Govt Motors) Ford did not and has the debt pile to show for it, $158 billion it total debt vs $38 billion in cash and a market cap of only $41 billion. This stock would be a toddlers hat size on the slightest whiff of a credit crisis. But that discussion is for another time.
The stock has shown very good relative strength over the last couple weeks, while many stocks filled in their earnings gaps in the SPX’s nearly 5% peak to trough decline of late, Ford held $10 like a boss! Which leads me to what will be building expectations into the G-20 meeting on June 28th in Japan that trump has said he will meet with the President of China in an effort to finally iron out a deal…
If you were optimistic that the rhetoric from both sides would point to some sort of compromise in late June, at a place where both sides could share the spotlight on an international stage, and that you expect stocks to rally into such an event, then a stock like Ford would likely be a primary beneficiary.
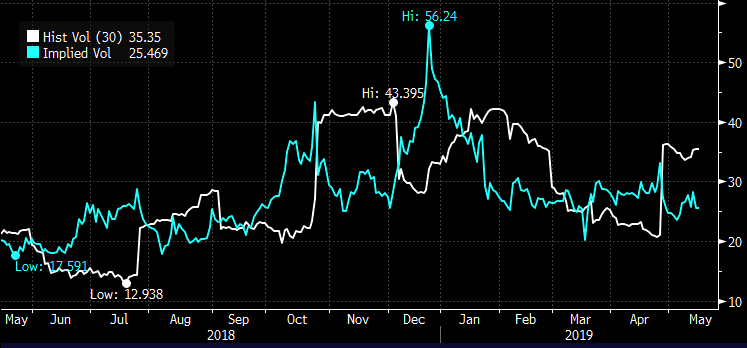
Short-dated options prices in Ford re down a lot from the Dec highs, but still 20% above the 52-week lows, signaling that more calm, or a slow and steady climb could cause prices to further erode (implied volatility, the price of options, the blue line below). But interestingly even with IV at 25% it is well below 30-day at the money realized vol at 35% (white line below, how much the underlying stock has been moving), possibly making options prices look cheap:
So what’s the trade? If I were inclined to play Ford from the long side, possibly targeting a rally into the G-20 in late may I might simply buy near the money calls.. .for instance:
Bullish Trade Idea: F ($10.35) Buy June 28th quarterly 10.50 call for 31 cents
Break-even on June 28th expiration:
Profits above 10.81
Losses of up to 31 cents between 10.50 and 10.81 with max loss of 31 cents below 10.50
Rationale: this trade idea risks ~3% of the stock price for a break-even up ~3%, the options market suggests there is about a 40% probability of the stock being near break-even on June 28th close.