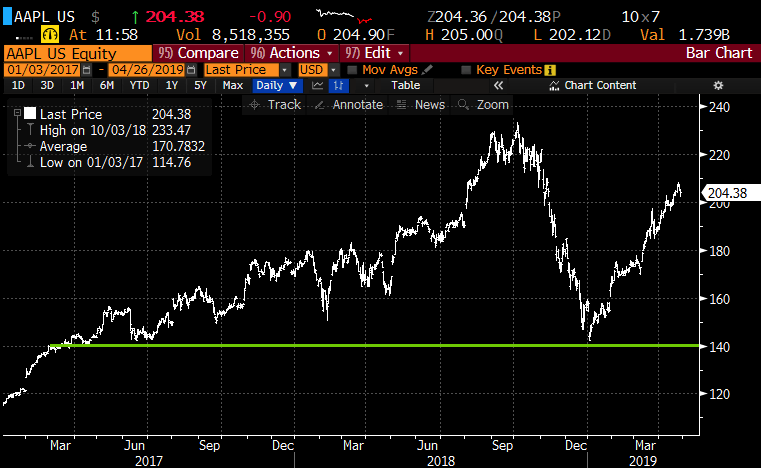
Apple (AAPL) will report their fiscal Q2 results Tuesday after the close. The options market is implying about a 4.5% move in either direction by next Friday’s close, or a little less than $10. The stock on average has moved about 6% the day after its last four quarterly reports, which does not include its 10% one day drop of January 3rd, 2019 following their first earnings pre-announcement in more than a decade. It is notable that since the stock’s close just above $142, which was a new 52-week low, the stock has rallied 45% in what appears to be a near perfect 45% degree angle, placing the stock up 30% on the year, but still down 12.5% from its all-time highs made on October 3rd:
It is fairly remarkable to consider the fact that the stock’s nearly 40% peak to trough decline, which lasted less than three months was not even the largest of the three 30% plus declines since the start of 2012:
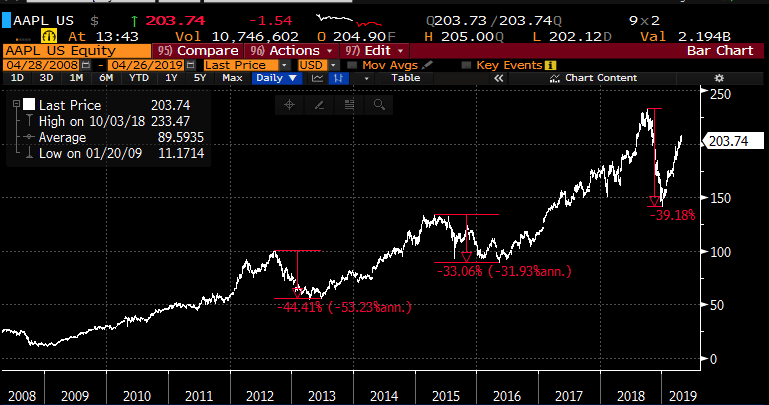
What’s clear from the chart above is that the prior two declines of greater than 30% took at least 9 months to find a bottom and nearly two years for each to make new all-time highs, There is just something about the Q3’18 blow-off top in the shares, the Q4’18 crash, and the Q1’19 V reversal that makes this time a bit more of a wild card.
But it is worth noting that there is a sort of pattern that has emerged with the stock’s sell-offs and the every-three-year annual eps decline. For instance, the stock’s 2012-2013 decline of 44% came in the throws of a 10% eps decline in fiscal 2013. The stock’s 2015-2016 decline of 33% came in the throws of the companies 10% eps decline in fiscal 2016.
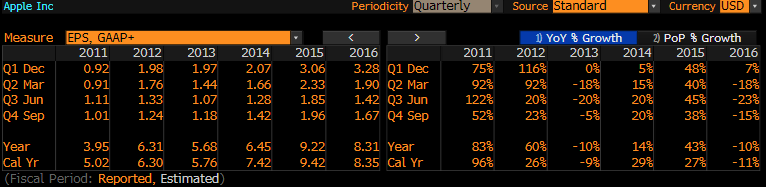
Wall Street analysts are currently expecting fiscal 2019 eps to decline 4% with a 4% decline in revenues. Were the Q4 crash and the Jan 3rd bottom that obvious? Well in hindsight yes, but that does not mean we will see new highs anytime soon. Judging by the past two cycles, investors took their sweet time in bidding the stock right back up.
It is also worth noting the guidance and the stock’s reactions just this week by two large customers of AAPL, Intel (INTC) at 6% of their revenues and Texas Instruments (TXN) at 7% of their revenues, and of Taiwan Semiconductor (TSM) at 21% of revs and Micron (MU) for their guidance on the current semi-cycle. Spoiler alert, it’s not great.
So what’s the trade? If I were long AAPL, concerned that the stock has run too far too fast, worried that no matter how good the qtr and guidance is will not be enough, or a miss and guide down could be met with a 10% plus drop, BUT you don’t want to sell your stock… you might consider a collar strategy against your long stock…selling an out of the money call and using the proceeds to buy and out of the money put in the same expiration, allowing for upside to a point, but most importantly defining risk in the stock to the put strike. An investor would collar their stock if they did not want to sell it but are more concerned with extreme downside into an event or over a stated period of time then they are about capping gains in the case of extreme upside. It also makes sense to place a hedge in the hours prior to the event to make sure the distance of the strikes lines up with your risk targets.
How a collar would work:
vs 100 shares of AAPL long at $204 Buy May 192.50 – 212.50 collar for even money
-Sell to open 1 May 212.50 call at $2.15
-Buy to open 1 May 192.50 put at $2.15
Break-even on May expiration:
Profits of the stock up to 212.50, gains capped above. If the stock is above 212.50 on May expiration the investors could always cover the short call to keep the long position in place.
Losses of the stock down to 192.50, protected below 192.50
Rationale: this trade idea targets the implied move in the stock post-earnings and is meant to give a sense of defined risk.
Again, the tradeoff is a limit to the potential upside for potential downside protection.