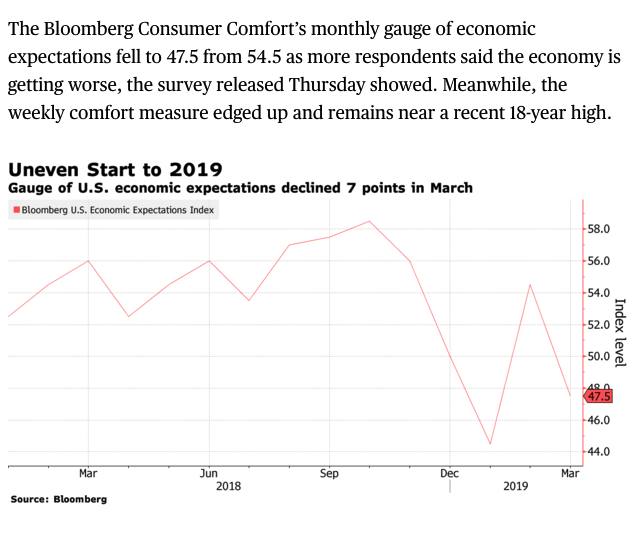
Data regarding the health of the U.S. consumer have been mixed so far this year as the hangover from the government shutdown in December and January lingered, possibly offset a bit from the sharp rebound in stock prices, and the decrease in interest rates. This volatility in consumer sentiment was highlighted by Consumer Confidence at 18-year highs, but also last week’s drop in Consumer Comfort for the fourth month in the last five, per Bloomberg:
Despite the strong University of Michigan Consumer Confidence reading on March 15th, “a measure of buying conditions for long-lasting goods fell to the lowest since 2015, suggesting consumers are reluctant to tap their rising incomes to make big purchases”. This is interesting because this can be a precursor to broader consumer weakness when consumers balk at making large purchases. US Autos sales are expected to decline by 2.5% in Q1 while Pending home sales dropped last month for the tenth time in the last twelve months, despite a sharp drop in mortgage rates this year.
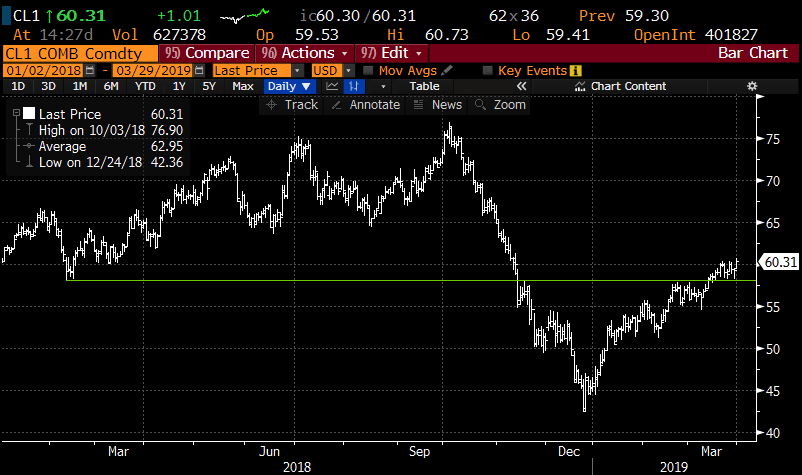
Oh, and Crude oil is trading today above $60 (if it closed here it will be the highest since November) and possibly breaking out which higher oil prices might put pressure on consumers and raise input costs for manufacturers:
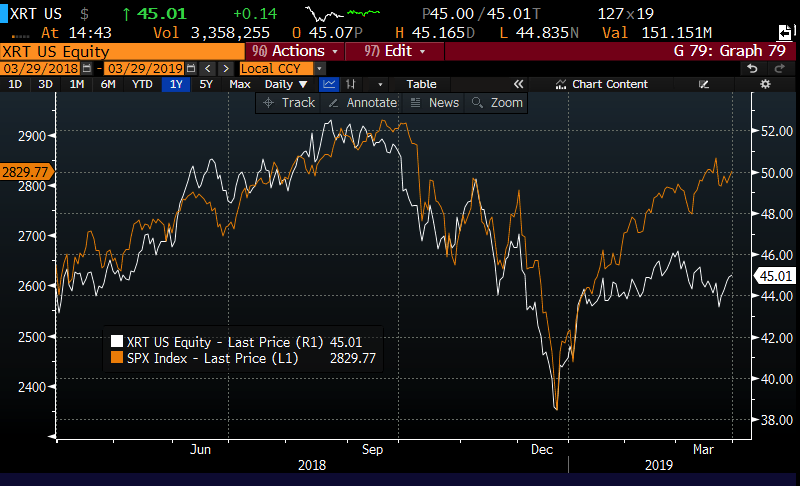
Which leads me to the XRT, the S&P Retail etf, which has underperformed the S&P 500 (SPX) ytd, up 9.8% vs 12.8% and off of the Christmas lows, 18% vs 20%. Maybe more importantly, the XRT remains 15% from its 2018 highs vs the SPX within 4% of its all-time highs made in September:
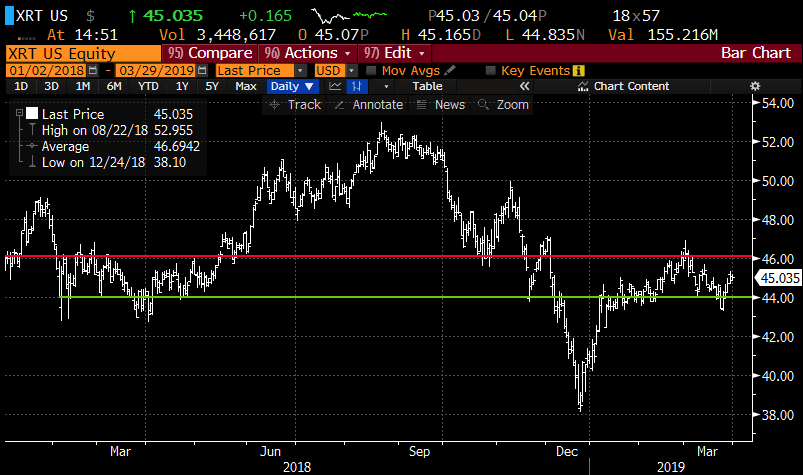
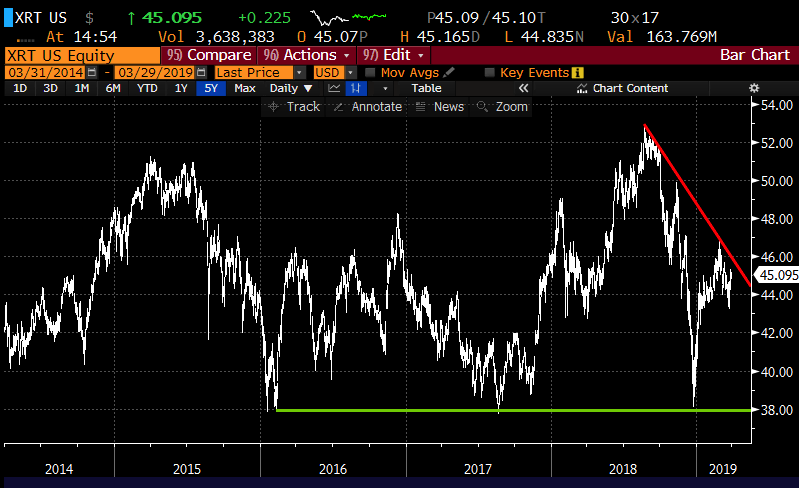
Markets have been sensitive to news regarding the trade impasse with China and the potential for more tariffs. Make no mistake, the $200 billion in tariffs trump has levied on Chinese imports is a tax on our consumer. Without some sort of resolution soon, this will continue to cut into purchasing power. That said any deal that merely curbs further tariffs or reduces existing is unlikely to turn consumer behavior on a dime. My sense is that the risk is the downside for retail stock before we get a trade deal. The XRT chart since the start of 2018 shows near-term resistance at $46 and support near $44 with and air pocket down to $38, the December low:
The five-year chart shows the series of lower highs and lower lows over the last year and what was a fairly obvious support level at $38 dating back to early 2016:
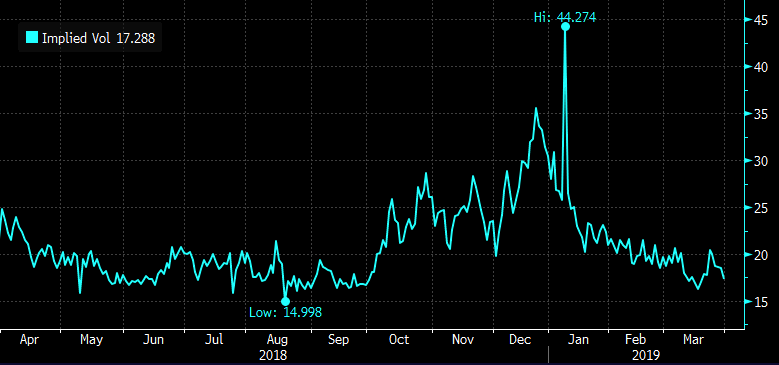
Short-dated options prices in the XRT are at 2019 lows, with 30-day at the money implied volatility at just 17%, making long premium directional trades look attractive:
So what’s the trade?
XRT ($45) Buy May 45 / 40 put spread for $1
-Buy to open 1 May 45 put for 1.15
-Sell to open 1 May 40 put at 15 cents
Break-even on May expiration:
Profits of up to 4 between 44 and 40 with a max gain of 4 below 40
Losses of up to 1 between 44 and 45 with a max loss of 1 above 45