Earlier in the week (It’s Like Alien vs Predator But It’s FAANG vs MAGA),I discussed the concentration within the QQQ, the Nasdaq 100 etf, with what I call MAGA (MSFT, AAPL, GOOGL & AMZN) making up 37% of its weight. Despite the QQQ being up 11.25% on the year and up 20% from the Christmas lows, it remains 7.5% from its all-time highs made on October 1st vs the Equal Weight Nasdaq 1000 etf, the QQQE, which is up 15.25% on the year and just 2% from its all-time highs made in the fall. Some bulls see this chart as bullish as large holdings which remain well off the highs are weighing down the market cap weighted index, while many other components are doing quite well.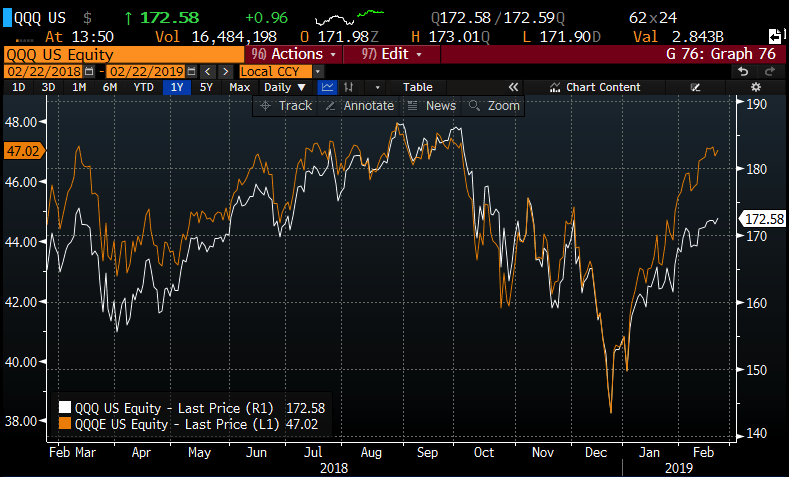
I make this point frequently, the concentration in MAGA or FAANG on the way up powered much of the gains in the broad market from late 2016 to the highs in Q3 2018, but they also masked a lot of bad performance in other parts of the U.S. stock market as many strategists have referred to as a rolling bear market in many subsectors of the market. Now we are seeing poor relative performance from the horses that got us to the 2018 highs and for the broad market to make new highs we will need MAGA to join the party. On the flip-side, as AAPL, GOOGL and AMZN continue to make any real progress of late, they pose a similar risk of dragging the market down as they did in late 2018.
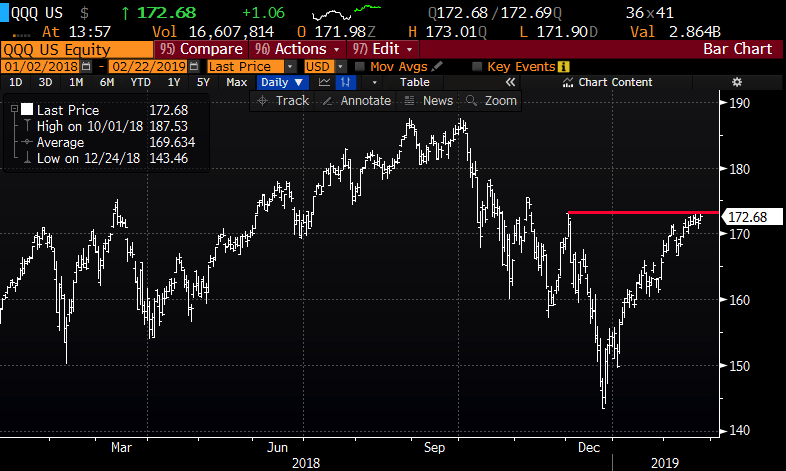
In Tuesday’s post, I highlighted all of these points and highlighted the technical set up in the QQQ, possibly facing some technical resistance at $173, right where it failed after the supposed “China Trade Deal” post the G-20 meeting in Argentina ending December 3rd.
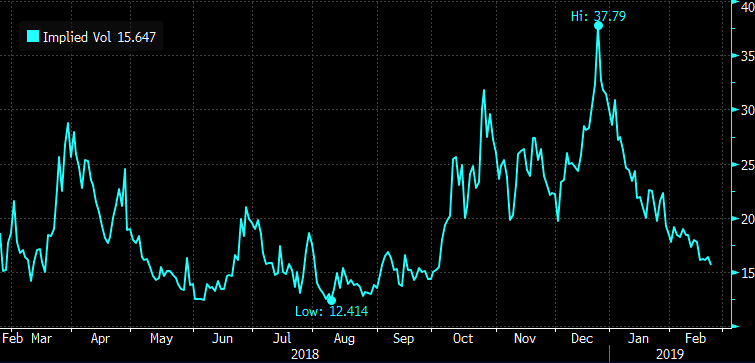
For those who are long mega-cap tech, the idea of using QQQ puts or put spreads as short term protection makes sense if you fear any expected announcement on a trade deal with China might meet a similar fate as it did in early December. With 30-day at the money implied volatility at 15.6%, well below the 1-year average of 21%:
Regular readers know we like to refer to the implied movement in the options market, which can usually be determined by taking the near-dated at the money straddle (the call premium + the put premium) and dividing by the stock or etf price. If you thought stock or etf could move a lot near term based on some catalysts with but unsure on direction, you could buy a straddle and you would need the stock to move more in either direction than the price of the straddle by expiration, for instance:
QQQ ($172.90) Buy March 173 straddle for $5
-Buy to open 1 March 173 call for $2.40
-But to open 1 March 173 put for $2.60
Break-even on March expiration:
Profits above 178 and below 168
Losses of up to 5 between 168 and 178 with max loss of 5 at 173