Last night on the Options Action segment on CNBC’s Fast Money I highlighted what appeared to be some bearish activity in the etf that tracks the Russell 2000 small-cap index, the IWM (watch below). Regular readers know that I do not place any particular emphasis on large options activity, without any specific knowledge of who was executing the trade, for what reasons, and what it might be against it is pretty much useless in my mind, and the minds of many professional investors I know. But as I state in the clip below, I suggest that this sort of action might be useful from a sentiment standpoint, or as it does with me, oftentimes is the impetus to look at a stock or an etf, and the activity might help inform strikes in trades that I am considering in the underlying based on moves in implied volatility (the price of options). A good example, if there was a lot of buying in a specific strike, in a specific expiration, and the price of options have been pushed up do to the activity, it could end up that those options could be a good sale, to help finance the purchase of other strikes in other expirations to make a similar directional bet.
Much like the post yesterday in the SPY (The Reflex… Is A Lonely Trade), the IWM is now approaching the breakdown level from December, but there are a couple very big differences between the two indices. First, as I noted in the clip, the IWM’s nearly 7% year to date rally, and 14% bounce from the Dec 24th lows dwarfs that of the SPX’s 3% ytd gain and the 10% bounce from its Christmas Eve lows. While the IWM has outperformed on the upside over the last two weeks it is important to note that it also outperformed the move to the downside from its all-time highs in late August, topping out a month before the SPX and sporting a 27% peak to trough decline vs the SPX’s 20% peak to trough decline.
The chart below dating back to late 2017 shows the IWM approaching key 1-year technical resistance near $145, which served as support in February and October of 2018 before breaking below in mid-December and careening $20, or 13.5% from December 13th to its recent low on December 24th. And you know the old market saying… that prior support now becomes resistance, well this will be a fairly important test to see if the year to date rally has legs:

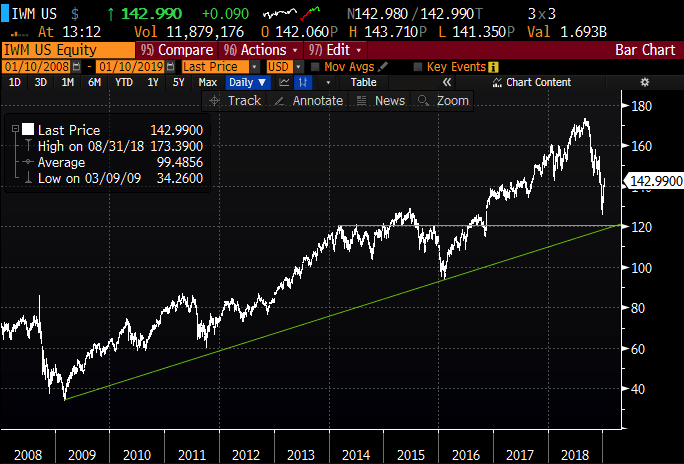
It’s also worth looking at the ten-year chart of the IWM from the lows of the financial crisis. The uptrend from the lows happens to intersect with what some might view as support near $120, which was the level the index bounced from just prior to the 2016 election that lead to a breakout to new highs in the coming weeks and ultimately a 50% rally into last August’s highs:
Again, I have no idea if the May puts that I highlighted in yesterday’s hit were an outright bearish bet, a hedge against a basket of small-cap stocks, or something else all-together…. but I would add that if the IWM does fail at resistance, and the symptoms that caused the IWM to decline at a greater degree to large caps in the last few months return in the next few weeks, or months, then targeting $120 to the downside makes sense to me, but buying 8% out of the money puts, 4 months out does not seem like the best way to do that.
If I were inclined to play for about a 15% move back towards $120 in the coming months I might consider the following trade idea:
Bearish Trade Idea: IWM ($142.80) Buy March 140 / 120 put spread for $3.30
-buy to open 1 March 140 put for 3.95
-Sell to open 1 March 120 put at 65 cents
Break-even on March expiration:
Profits of up to 16.70 between 136.70 and 120 with max gain of 16.70 at 120 or lower.
Losses of up to 3.30 between 137.70 and 140 with max loss of 3.30 at 140 or higher.
Rationale: this trade idea risks 2% of the IWM to possibly make up to nearly 12% if the etf is down 15% in the next two months, retracing a little more than the entire move of the last two weeks. Pretty attractive risk-reward in my opinion if you think that the market fails soon, that it re-tests the recent lows and that IWM outperforms to the downside.