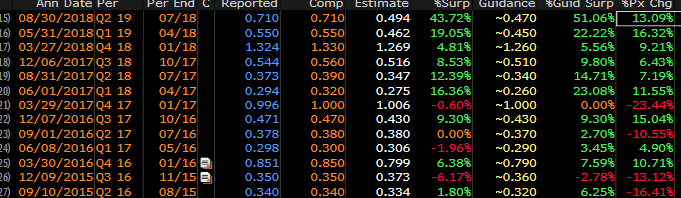
Lululemon (LULU) reports their fiscal Q2 results tonight after the close, the options market is implying about an 11% one day move tomorrow that is basically in line with its average one-day post-earnings move over the last four quarters. The post-earnings movement has been off the hook look below at the far right column that says % px chg, that is the one day move after earnings dating back to Sept 2015, off the hook:
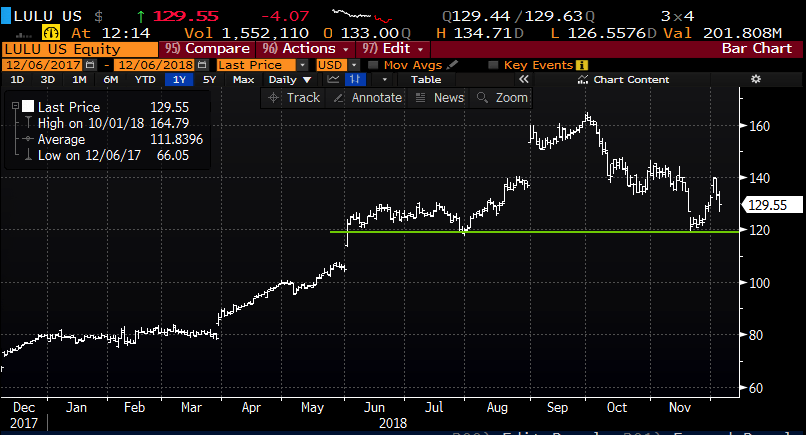
Despite being down about 20% from its 52-week and all-time highs on October 1st, shares of LULU are still up a whopping 65% on the year. The stock’s recent bounce off of $120 two weeks ago highlights what appears to be obvious near-term technical support:
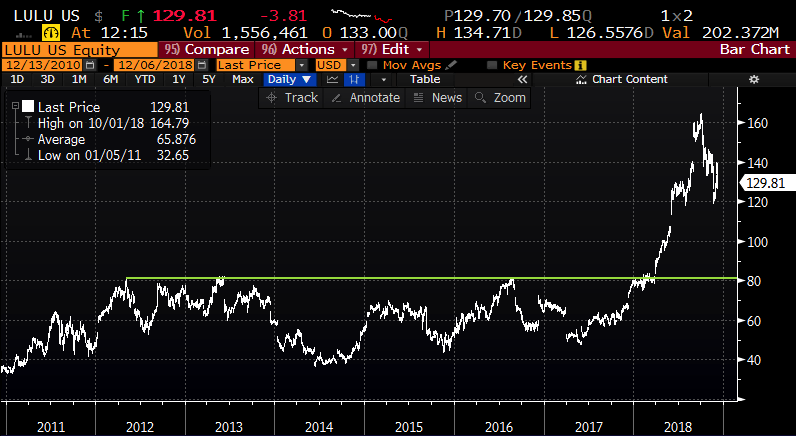
Taking a longer-term view, the stock’s multi-year consolidation between $40 and $80 dating back to 2011 saw a fairly dramatic resolution earlier this year, at one point seeing gains of 100%:
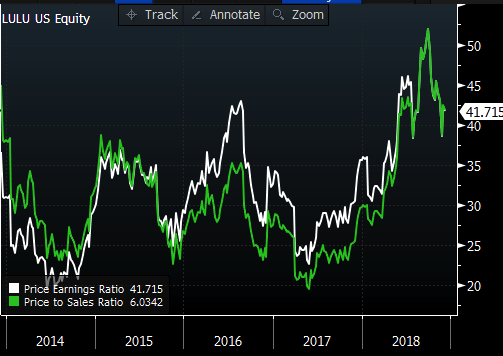
Investors have responded to the company’s return to an acceleration of double-digit sales and eps growth (expected for fiscal 2019) of 22% and 39% respectively. The stock’s rise though has caused its valuation to start to look just a tad rich as the stock’s return far outstrip growth, as LULU’s P/E and Price to Sales ratios are approaching new five-year highs:
Wall Street analysts remain fairly mixed on the stock with 22 Buy ratings, 13 Holds and 2 Sells with an average 12-month price target of $164, back near the recent highs.
So what’s the trade? The stock is obviously priced for perfection, a miss and guide down and the stock is easily down in line with the implied move. While it would take a considerable beat and raise in my opinion for the stock to rise the 11% implied movement.
if I were inclined to play for a miss I would target a move that outperforms the implied movement possibly filling int the earnings gap from early June when the stock was just above $100:
BEARISH TRADE IDEA: LULU ($130) BUY Dec 21st 125 / 105 PUT SPREAD FOR $4.50
-Buy to open 1 Dec 21st 125 put for $5.50
-Sell to open 1 Dec 21st 105 put at $1
Break-even on Dec expiration:
Profits of up to 15.50 between 120.50 and 105 with max gain of 15.50 below 105
Losses of up to 4.50 between 120.50 and 125 with max loss of 4.50 at 125 or higher.
Rationale: this trade idea risks 3.4% of the stock price over the next two months with a max potential gain of 12% targeting a move back to last quarter’s breakout.
Or If I were inclined to play for a bounce in-line with the implied move I might just make it a one day trade in the weeklies…. for instance (there is a big BUT below):
Bullish Trade Idea: LULU Buy Dec 7th 135 / 145 call spread for $3
-Buy to open 1 Dec 7th weekly 135 call 4.85
-Sell to open 1 Dec 7th weekly 145 call at 1.85
Break-even on Dec 7th weekly expiration (tomorrow):
Profits of up to 7 between 138 and 145 with max gain of 7 above 145
Losses of up to 3 between 135 and 138 with max loss of 3 at 135 or lower
Rationale: this trade idea risks 2.3% of the stock price for one day. This is a risky traded set up, get the direction wrong and it is a total loser. One would only do a trade like this if they were very convicted on the outcome of earning and that outcome would have the stock up 10% the next day, which has basically been the average move over the last many years.
DISCLAIMER: this is not a trade I would do, its basically a coin toss with worse odds. as we often like to say that long premium directional short dated trades into events like earnings are a very tough way to make money on a consistent basis, you need to get a lot of things right to merely break-even, direction, timing and magnitude of the move.