Shares of General Electric (GE) are getting lit up to the tune of 8% on the downside on an estimate cut and a price target cut by JP Morgan research analyst Stephen Tusa to $6, suggesting in a note to clients this morning:
The outcome of GE results was worse than expected on almost all fronts, with forecasts for FCF and EBITDA moving materially lower ($2.5 B and $1.5 B, respectively) coming away, while a material change in language from the 10Q suggests a negative step down in the leverage situation. Some sell-side bulls now point to “liquidity concerns” as the driver of share price weakness, though this misconstrues the Real Bear Case (RBC) – namely $100 B in liabilities and zero enterprise FCF even after a 95% dividend cut. While the stock is down ~70% from the peak of $30, this move still does not sufficiently reflect the fundamental facts, in our view.
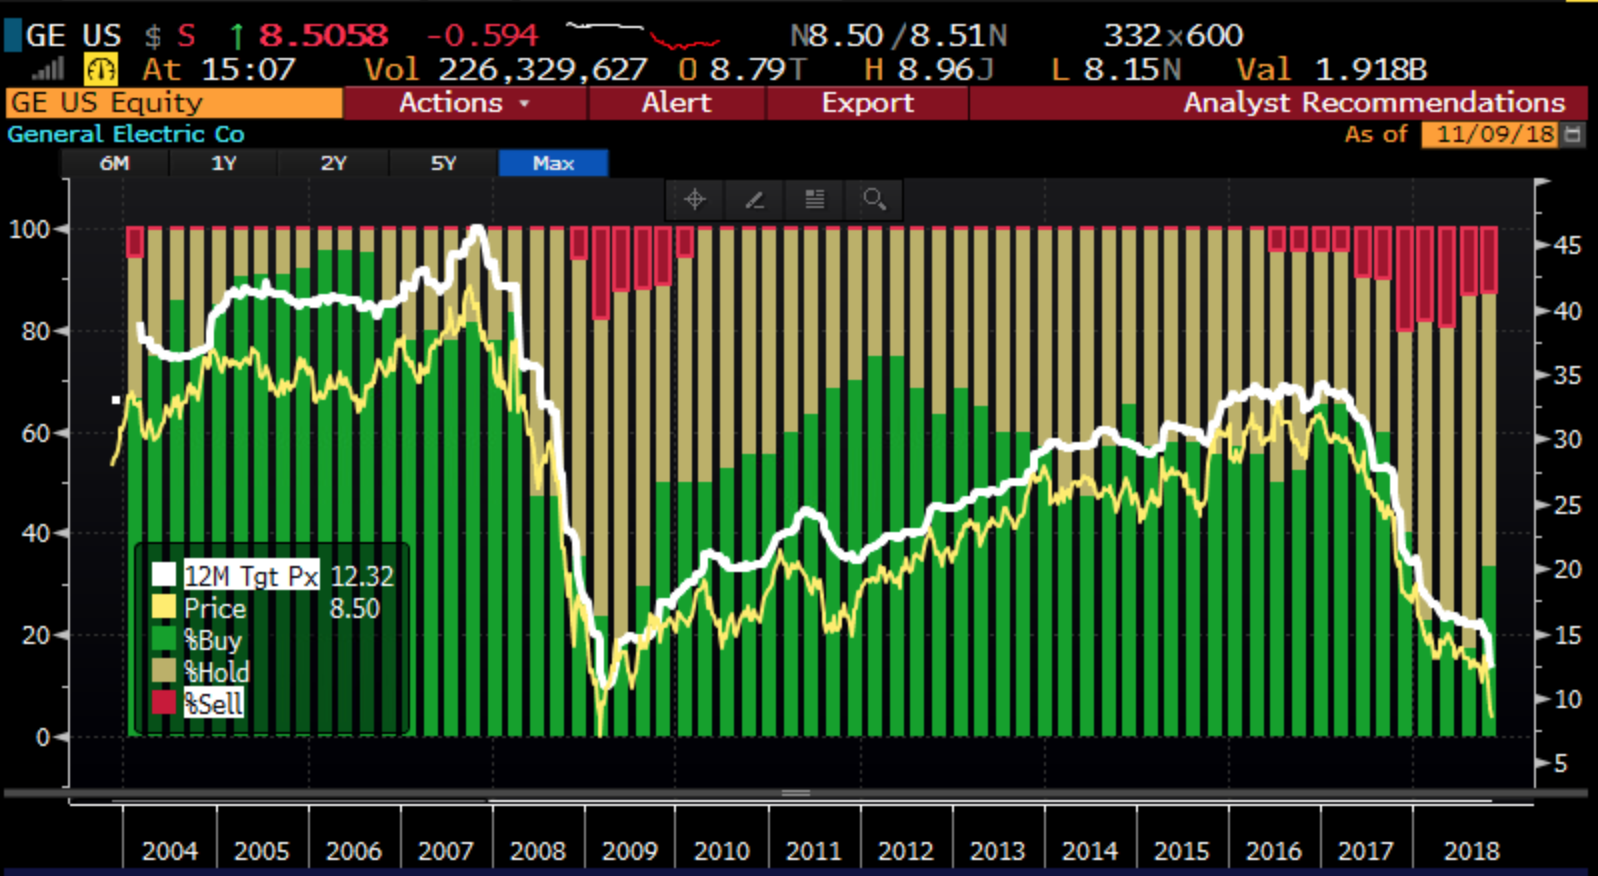
To suggest that sentiment has gotten downright horrid in the stock is an understatement, punctuated by its ytd losses of 50%, and analysts with Buy ratings at just about one third, of those that cover the stock, very near the lowest levels since 2009 in the throes of the financial crisis, or the last time the stock was a hat size, per Bloomberg:
The company has gotten very hard to value, and Tusa suggests that consensus estimates have a ways to come down in line with his street lows:
Fresh cut of numbers shows material downside to consensus still exists – we are 60% below for 2019/2020. Incorporating trend lines on fundamentals (see bullet below), portfolio moves, and adding restructuring brings 2019 EPS / FCF per share (GE defined) to $0.35/$0.31 (Street EPS at $0.85-0.90) and 2020 to $0.41/$0.35 (Street EPS at $1).
As for the charts, I’m not really sure what to say… technicians will eye that March 4th 2009 low, which saw the stock trade in a 24% one day range, as high as $7.25, and as low as $5.73 to close the day at $6.69. With the stock up almost 100% in the month that followed:
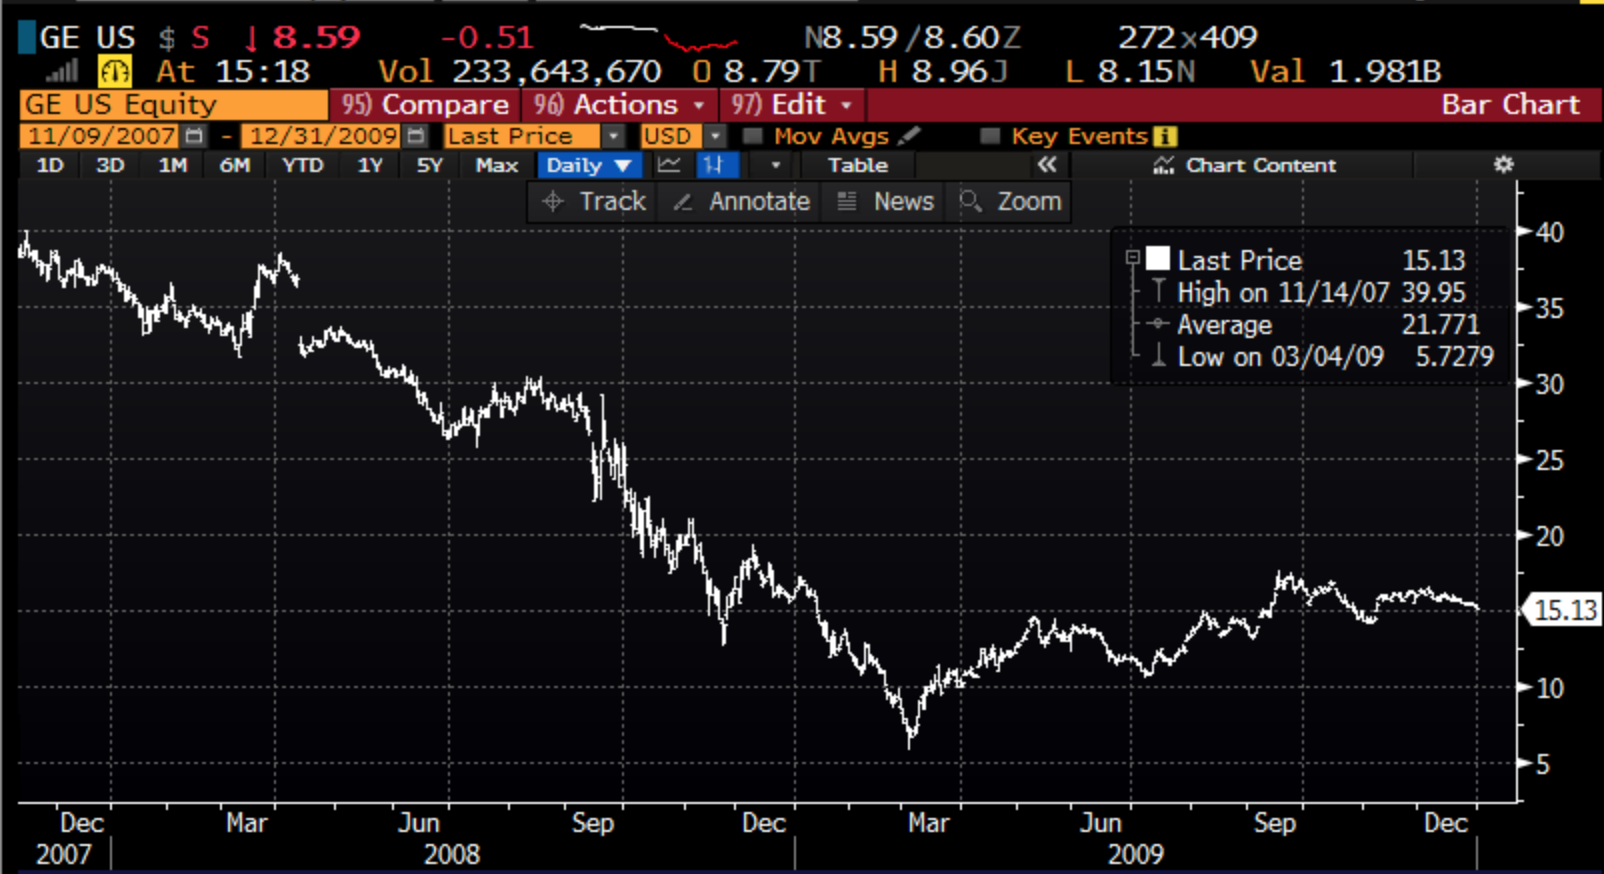
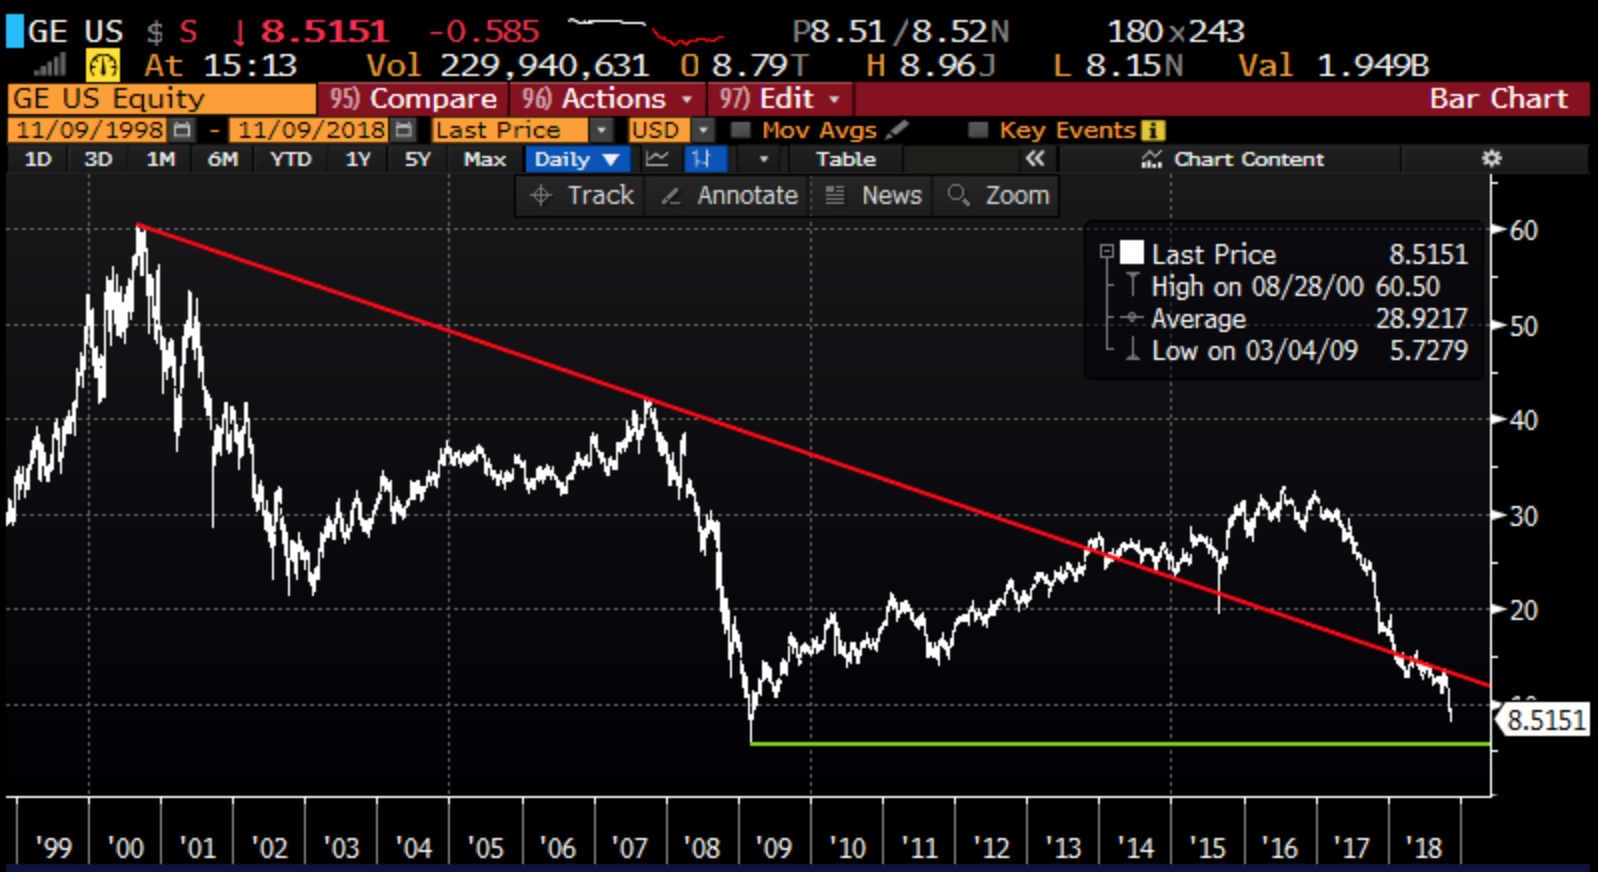
That low in early 2009 is really the only point of reference to the downside at this point. I would add that the cluster of closes really does look closer to $8 than $6, and maybe just maybe on the next wholesale earnings downgrade the stock sees a V bottom like in 2009:
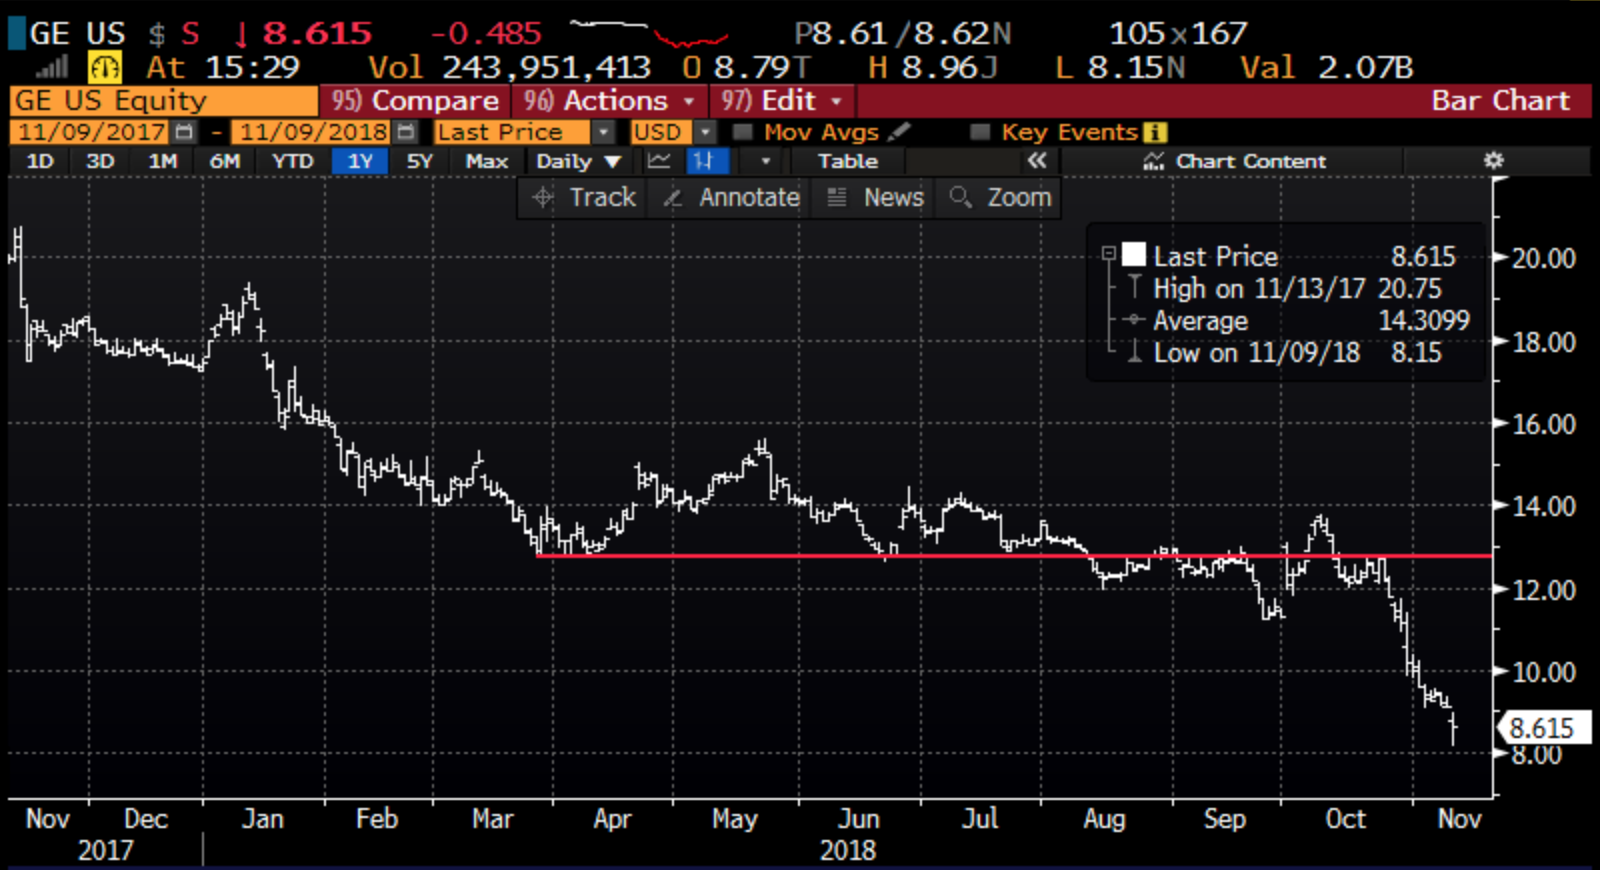
If I were to try to catch a falling knife in a stock like this, I would do so with defined risk, I would give it a little time to play out, and I would target the recent breakdown level near $13:
So what’s the Trade? If you are inclined to be a little contrarian here, and risk what you are willing to lose, out of the money call spreads look dollar cheap:
Bullish Trade Idea: GE ($8.65) Buy March 10 / 13 call spread for 40 cents
-Buy to open 1 March 10 call for 50 cents
-Sell to open 1 March 13 calls at 10 cents
Break-even on March expiration:
Profits of up to 2.60 between 10.40 and 13 with max gain of 2.60 at 13 or higher
Losses of up to 40 cents between 10 and 10.40 with max loss of 40 cents at 10 or lower.
Rationale: while this trade down not break-even until $10.40, up 20%, the way the stock is moving it actually has a fairly reasonable chance to be in the money, about 35%. And the potential 6.5x payout if the stock is $13 or higher on March expiration is attractive. Its important to note that the stock was $13 last month.
I AM BY NO MEANS SAYING GE IS A BUY HERE, WHAT I AM SAYING THAT RISKING LESS THAN 5% OF THE STOCK PRICE TO POSSIBLY MAKE 30% IF THE STOCK IS UP 50% ON MARCH EXPIRATION LOOKS ATTRACTIVE FOR A STOCK WITH SUCH POOR SENTIMENT AND HAS BEEN THIS VOLATILE.